Statistical degrees of freedom - What are they REALLY?
TLDRThis video explores the concept of degrees of freedom in statistics, focusing on their importance in inferential tests like t-tests and variance estimation. Degrees of freedom are explained through both traditional and geometric viewpoints, highlighting how they relate to sample size and statistical calculations. The video delves into the relationship between data vectors, residuals, and errors, using visual and intuitive examples to clarify why degrees of freedom matter in statistical modeling and how they affect the accuracy of variance estimates.
Takeaways
- 📚 Degrees of freedom are a critical concept in introductory statistics, used when conducting inferential tests on a sample to infer about a larger population.
- 🔍 They are related to the sample size and are necessary when analyzing a sample without additional information about the population, such as the mean or variance.
- 📉 The p-value obtained from statistical tests like t-tests or correlations depends on the degrees of freedom, which influences whether a result is significant.
- 🧩 Degrees of freedom represent the amount of information that is free to vary, often in the context of variance estimation.
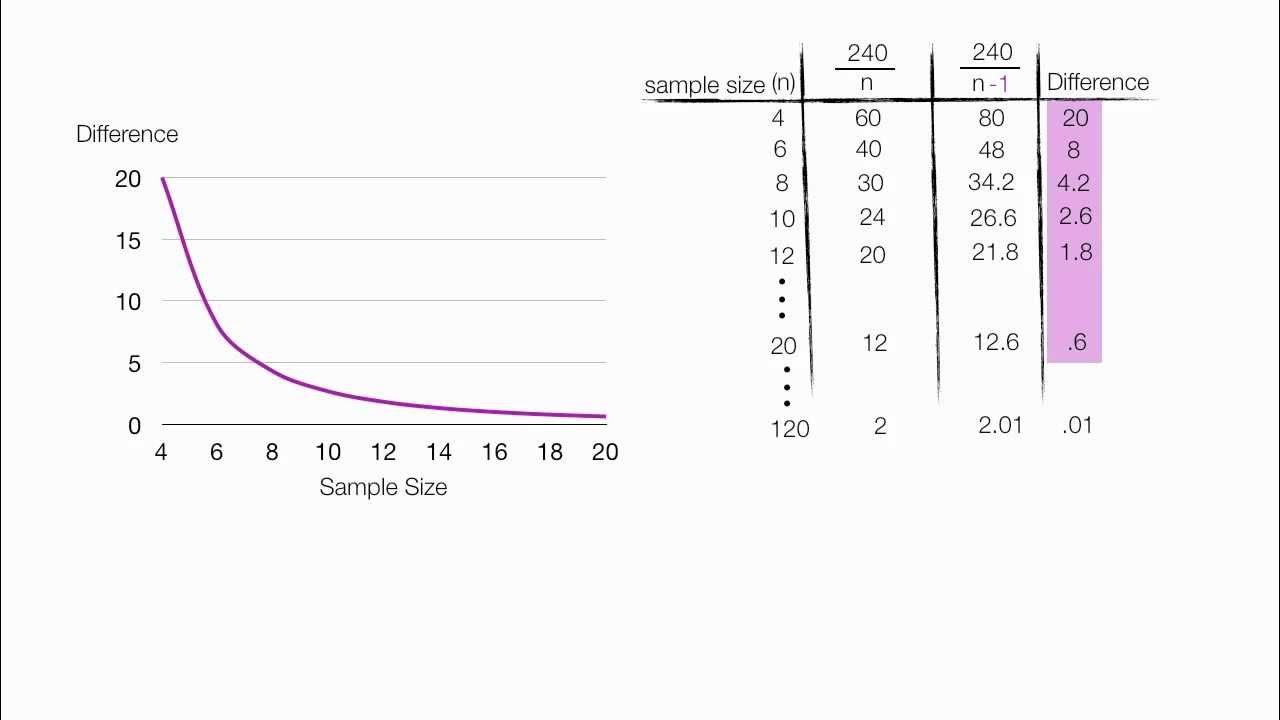
- 📈 When estimating the variance of a population from a sample, dividing by the degrees of freedom (n-1) is necessary because only n-1 data points are independent.
- 🤔 The concept can be confusing because it seems counterintuitive that the degrees of freedom change based on whether the population mean is known or not.
- 📊 A geometric interpretation of degrees of freedom can help understand them better, by treating data as vectors and considering the dimensions they can move in.
- 📐 In the context of variance estimation, the residual vector (representing deviations from the mean) is constrained to be perpendicular to the mean vector, reducing the degrees of freedom to n-1.
- 🔄 The mean vector is fixed and represents the best single value to explain the data, while the residual vector shows how well this model explains each data point.
- 🌐 When using the population mean, the error vector is not constrained to be perpendicular to the mean vector, allowing it to move freely in n dimensions, hence using n degrees of freedom.
- 🔮 Understanding degrees of freedom is essential for correctly estimating variance and avoiding biases that arise from using the sample mean instead of the population mean.
Q & A
What is the concept of degrees of freedom in statistics?
-Degrees of freedom in statistics are a quantity related to the sample size and used when conducting inferential tests. They represent the number of independent pieces of information or values that can vary freely within a sample.
Why are degrees of freedom important in statistical tests?
-Degrees of freedom are important because they affect the p-value in statistical tests. The significance of a result can depend on the degrees of freedom, in addition to the calculated T or R value based on the sample.
Can you explain the common example of degrees of freedom in variance estimation?
-In variance estimation, degrees of freedom are used because when you know the population mean, all data points are free to vary (n degrees of freedom). However, when using the sample mean, only n-1 data points are free to vary, as the last one is determined by the mean, hence n-1 degrees of freedom.
How does the concept of degrees of freedom relate to the geometry of statistics?
-The concept of degrees of freedom can be understood geometrically by treating data as vectors and considering the dimensions they can move in. For instance, when estimating the mean, the residual vector can only move in n-1 dimensions, which is why we use n-1 degrees of freedom.
What is the difference between residuals and errors in the context of degrees of freedom?
-Residuals are the deviations from the sample mean, and they have n-1 degrees of freedom because they must be perpendicular to the mean vector. Errors, on the other hand, refer to the deviations from the population mean and have n degrees of freedom because they are not constrained to be perpendicular to the mean vector.
How does the use of sample mean versus population mean affect the degrees of freedom?
-When using the sample mean, the degrees of freedom are reduced to n-1 because the residual vector is constrained to be perpendicular to the mean vector. However, when using the population mean, all n data points are free to vary, so the degrees of freedom are n.
Why do we divide by n-1 instead of n when calculating the sample variance?
-Dividing by n-1 instead of n corrects for the bias in estimating the population variance from the sample variance. This is because the sample mean imposes a constraint on the residuals, reducing the degrees of freedom to n-1.
Can you provide an example to illustrate the concept of degrees of freedom?
-Sure, if you have two data points (2 and 6), and you are estimating the variance, you would divide the sum of squared deviations from the mean by n-1 (which is 1 in this case) because only one degree of freedom is left after accounting for the mean.
What is the relationship between degrees of freedom and the geometry of the data vectors?
-Degrees of freedom can be understood as the number of dimensions a data vector can move in. For example, in 2D space, the residual vector can only move along a line perpendicular to the mean vector, hence having 1 degree of freedom.
How does the concept of degrees of freedom apply to tests other than variance estimation?
-The concept of degrees of freedom applies to other tests like t-tests, ANOVA, and regression analysis, where the degrees of freedom are used to adjust the calculations to account for the constraints imposed by the estimation of parameters like the mean.
Outlines
📚 Introduction to Degrees of Freedom in Statistics
This paragraph introduces the concept of degrees of freedom in statistical tests, which is often a source of confusion. Degrees of freedom relate to the sample size and are crucial when conducting inferential tests on a sample to infer about a larger population without additional information like the mean or variance. The significance of a result often depends on the degrees of freedom, in conjunction with the calculated T or R value. The paragraph also touches on the common explanation of degrees of freedom as the number of independent values in a data set that can vary freely when estimating parameters like the variance.
📐 Geometric Interpretation of Degrees of Freedom
The paragraph delves into a geometric interpretation of degrees of freedom, likening them to the dimensions in which a vector can move in mechanics. It explains that when estimating the variance of a population from a sample, the sample mean imposes a constraint on the data, reducing the degrees of freedom to n-1. This is visualized by partitioning the data vector into a mean vector and a residuals vector, with the latter being perpendicular to the mean vector. The concept is extended to higher dimensions, illustrating how the degrees of freedom correspond to the number of dimensions a residuals vector can occupy after accounting for the mean.
🔍 Why Residuals Must Be Perpendicular to the Mean Vector
This section explores the necessity of residuals being perpendicular to the mean vector. It offers several explanations: the geometric constraint that ensures the equation data = mean + residuals holds true, the balance point concept where the mean is the center of mass for the data points, and the statistical rationale that model errors (residuals) should be independent of the model itself (the mean). The independence implies orthogonality, leading to the residuals vector being confined to a line or plane perpendicular to the mean vector.
📉 Understanding the Relationship Between Residuals and Errors
The paragraph clarifies the difference between residuals and errors in the context of sample means versus population means. When the population mean is unknown, the residuals vector is constrained to be perpendicular to the sample mean vector, reducing the degrees of freedom. However, when the population mean is known, the errors vector is not constrained and can move freely in all dimensions provided by the data. This distinction is important for variance estimation, as using the sample mean can lead to an underestimation of the population variance, necessitating the use of n-1 in the denominator when calculating the sample variance.
🌟 Degrees of Freedom as a Property of Data Vectors
The final paragraph emphasizes that degrees of freedom are not just a property of statistical tests but are inherent to the data vectors used in these tests. It explains that the average length of the residuals vector is shorter than that of the errors vector when using the sample mean for estimation, which introduces bias that can be corrected by using n-1 instead of n in the variance formula. The analogy of a stick and its shadow is used to illustrate this concept, showing how the residuals vector is like a shadow that is constrained to move in fewer dimensions than the actual error vector.
Mindmap
Keywords
💡Degrees of Freedom
💡Inferential Tests
💡Sample Size
💡Variance Estimation
💡Mean
💡T-test
💡Correlation
💡Geometric View
💡Residuals
💡Population Mean
Highlights
Degrees of freedom are a fundamental concept in introductory statistics, relating to sample size and used in inferential tests.
Degrees of freedom are crucial for determining the p-value in statistical tests, which can affect the significance of results.
The concept of degrees of freedom is often misunderstood, with this video aiming to clarify its importance and application.
Degrees of freedom refer to the number of independent pieces of information in a data set that can vary.
When estimating the variance of a population from a sample, the degrees of freedom is n-1, due to the dependency created by calculating the mean.
The video uses the example of estimating the variance to illustrate the concept of degrees of freedom in a practical scenario.
A geometric interpretation of degrees of freedom is presented, treating data points as vectors and examining their dimensions.
The mean vector is shown to be a constant model that explains the data, while the residual vector represents the model's errors.
Residuals are always perpendicular to the mean vector, which is a key geometric property used in the explanation.
The independence of the model and the model's errors is emphasized, suggesting that residuals should not grow along the mean vector.
The video explains why using the sample size instead of the degrees of freedom can lead to overestimation in certain statistical estimates.
When the population mean is known, all n data points are free to vary, unlike when only the sample mean is known.
The concept of degrees of freedom is applied to higher dimensions, illustrating how it changes with more complex data sets.
The video concludes by emphasizing that degrees of freedom are properties of the data vectors used in statistical tests, not the tests themselves.
The geometric approach to understanding degrees of freedom can help in various statistical tests, including variance estimation, t-tests, and regression.
The video uses analogies, such as the shadow of a stick, to help viewers intuitively grasp the concept of degrees of freedom.
Transcripts
Browse More Related Video


5.0 / 5 (0 votes)
Thanks for rating: