Least Squares Regression Line on the TI83 TI84 Calculator
TLDRThis instructional video demonstrates how to calculate and graph the least squares regression line using a TI-83/84 calculator. The process involves inputting explanatory and response values into designated lists, enabling diagnostics, and utilizing the calculator's statistical functions to determine the line's slope and y-intercept. The video then guides users through creating a scatter plot and overlaying the regression line for a clear visual representation of the data trend.
Takeaways
- 📊 The video provides a tutorial on finding the least squares regression line using a TI-83/84 calculator.
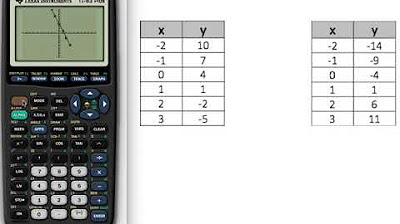
- 🔢 To begin, input the explanatory x-values into L1 and the response y-values into L2 using the Stat Edit function.
- 📝 Ensure that the calculator's Diagnostics feature is turned on, which can be checked in the second catalog.
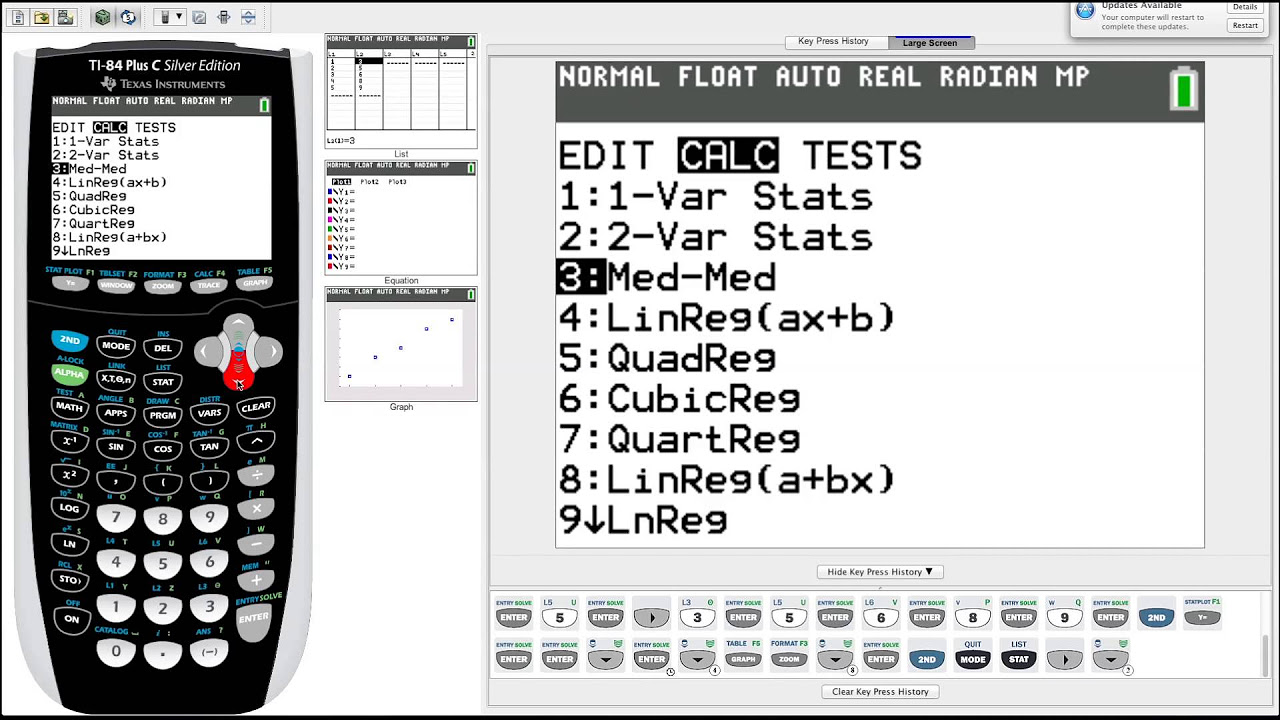
- 🧮 Navigate to Stat Calculate and select the least squares regression line calculation, noting that it requires four decimal places.
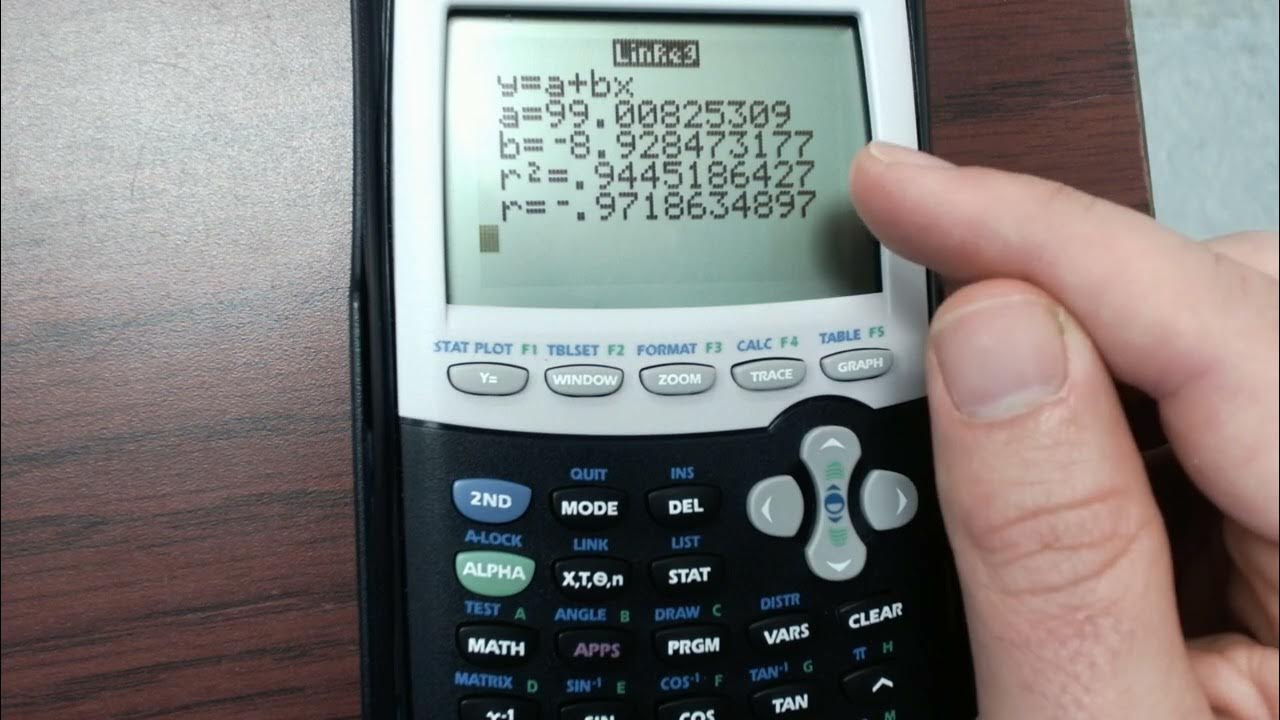
- 📈 The result will display the slope (a) and y-intercept (b) of the regression line.
- 📱 To graph the data, enter the scatter plot mode and select the appropriate lists for X and Y values.
- 🖌️ Use the zoom stat function (Zoom 9) to better visualize the data points and their distribution.
- 🔍 To add the regression line to the scatter plot, input the equation in the Y= field using the calculated slope and y-intercept.
- 📏 The video suggests two methods for inputting the equation: manually typing the values or using the VARs and Statistics functions for exact values.
- 🔗 The regression line should ideally pass through or near the data points on the scatter plot, with some points above and some below the line.
- 💡 The process allows for the combination of the scatter plot and the regression line, providing a visual representation of the data's trend.
Q & A
What is the main topic of the video?
-The main topic of the video is how to find the least squares regression line on a TI-83/84 calculator.
Where do you input the explanatory x-values and response values on the calculator?
-You input the explanatory x-values into L1 and the response values into L2, which is done through the Stat Edit menu.
How do you activate the Diagnostics feature on the TI-83/84 calculator?
-To activate the Diagnostics feature, navigate to the second catalog, turn on Diagnostics, and then press enter.
What menu do you access to calculate the least squares regression line?
-You access the Stat Calculate menu to calculate the least squares regression line.
What does the 'a' value represent in the least squares regression line equation?
-In the least squares regression line equation, 'a' represents the slope of the line.
What does the 'B' value represent in the least squares regression line equation?
-In the least squares regression line equation, 'B' represents the y-intercept of the line.
How many decimal places does the calculator require for the slope and y-intercept values?
-The calculator requires four decimal places for both the slope and y-intercept values.
How do you graph the data points along with the regression line on the calculator?
-You graph the data points using the scatter plot option in the Stat Plot menu, setting the X list to L1 and the Y list to L2.
What zoom option should you use to display the scatter plot and regression line?
-You should use the Zoom 9 option, also known as the Zoom Stat, to display the scatter plot and regression line.
How can you obtain the exact slope and y-intercept values for the regression line?
-You can obtain the exact slope and y-intercept values by navigating to the VARS menu, then Statistics, and finally Equation to find 'little a' and 'little B' values.
How can you visually check the accuracy of the regression line?
-You can visually check the accuracy of the regression line by observing how closely the data points align with the line on the scatter plot.
Outlines
📊 Finding the Least Squares Regression Line on TI-83/84
This paragraph provides a step-by-step guide on how to find the least squares regression line using a TI-83 or TI-84 calculator. It begins with the process of inputting explanatory x-values and response values into lists L1 and L2 via the Stat Edit function. The user is then directed to enable Diagnostics in the calculator's settings. The next steps involve navigating to Stat Calculate and entering commands to retrieve the slope (a) and y-intercept (B) of the regression line, ensuring to input values to four decimal places. The paragraph further explains how to graph the data using a scatter plot and overlay the regression line on the graph. Two methods for inputting the regression equation are described: typing the values directly or using the calculator's VARs and Statistics functions to obtain the exact slope and intercept. The paragraph concludes with a visual verification of the regression line fitting the plotted data points.
Mindmap
Keywords
💡Least Squares Regression
💡TI-83/84 Calculator
💡Explanatory X-values
💡Response Y-values
💡Diagnostics
💡Stat Calculate
💡Slope (a)
💡Y-intercept (b)
💡Scatter Plot
💡Zoom Stat
💡Graphing
Highlights
The video demonstrates how to find the least squares regression line on a TI-83/84 calculator.
Explanatory x-values and response values must be entered into L1 and L2 respectively under Stat Edit.
Diagnostics should be turned on in the calculator's settings for this process.
Navigate to Stat Calculate and select the least squares regression line option.
The slope (a) and y-intercept (b) of the line are displayed, requiring four decimal places.
To graph the data, use the scatter plot option and select X list as L1 and Y list as L2.
Zoom Stat (Zoom 9) is used to visualize the data points and regression line clearly.
The regression line equation can be entered manually or retrieved using the calculator's VARs and Statistics features.
The slope (little a) is found under VARs, Statistics, and Equation.
The y-intercept (little B) is also obtained from the VARs, Statistics, and Equation menu.
Using the exact values for the slope and intercept ensures the regression line accurately fits the data.
The video provides a step-by-step guide on how to match the regression line with the scatter plot of data points.
Data points above and below the line can be observed and matched to verify the line's accuracy.
The method shown is practical for students and professionals needing to perform regression analysis using a TI-83/84 calculator.
This tutorial is beneficial for those without access to advanced statistical software.
The process simplifies the understanding and application of least squares regression in a classroom or learning environment.
Transcripts
Browse More Related Video
TI-84 Plus Graphing Calculator Guide: Statistics

How to do Linear Regression on the TI84 Plus CE

Pre-Calculus - Find the linear regression line using the TI-83/84 calculator (2)
Input a table of values into a Graphing Calculator and construct a line
Residual Plot on TI-84 Plus
Calculating the equation of a regression line | AP Statistics | Khan Academy
5.0 / 5 (0 votes)
Thanks for rating: