Motion diagrams
TLDRProfessor Anderson introduces motion diagrams as a visualization tool for object movement, using the example of a person running. He explains how to interpret changes in position and speed from the diagrams, emphasizing the importance of defining positive and negative directions. The concept of acceleration is also discussed, with constant velocity implying zero acceleration. The summary highlights the informative nature of these diagrams in understanding an object's motion over time.
Takeaways
- 🌟 Motion diagrams are a tool to visualize the movement of objects in the universe, such as a person running.
- 📸 A stroboscopic picture of a runner taken at different intervals can show the progression of their movement.
- 🎥 In the past, film cameras allowed for long exposure shots capturing multiple stages of motion.
- 📐 To interpret motion diagrams, one must first define the positive and negative directions for position.
- 🏃♂️ The change in position over time can indicate if the speed is increasing, decreasing, or remaining constant.
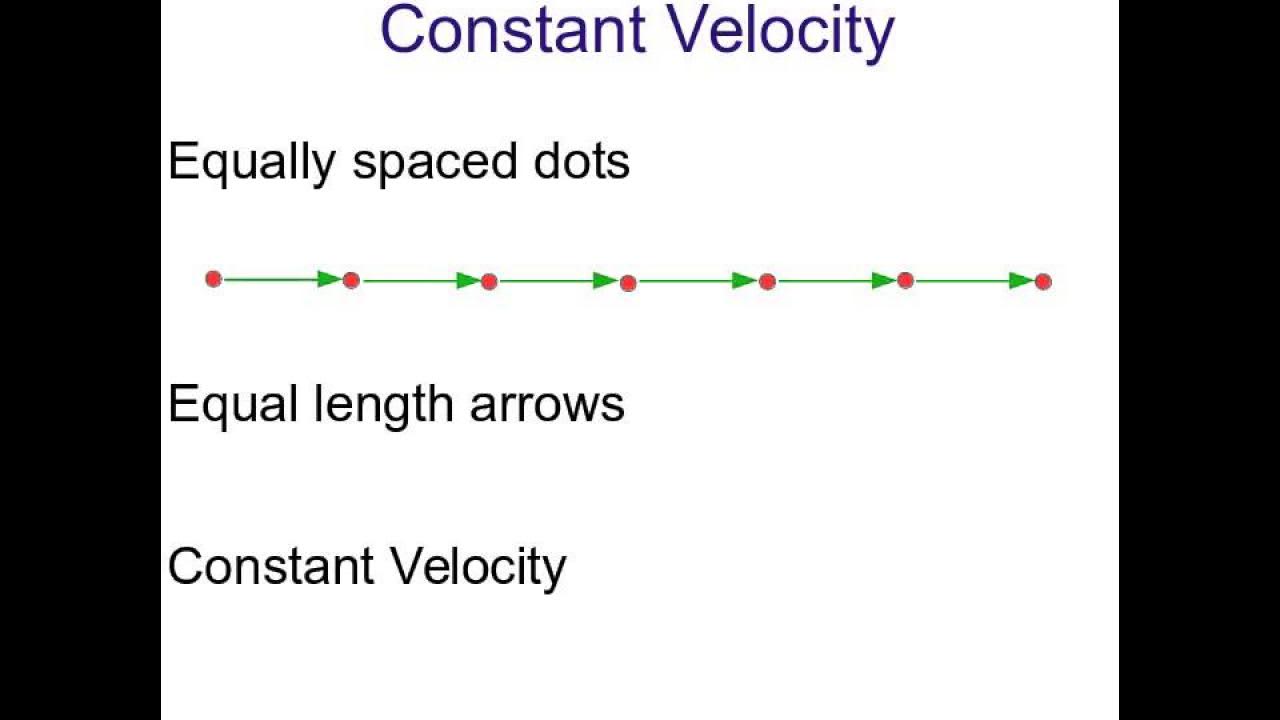
- 📊 A motion diagram can be simplified by using dots to represent the object's position at different times.
- 📈 By assigning numerical values to the positions and intervals, one can analyze the motion more quantitatively.
- 🏁 If all intervals between positions are equal, it suggests the object is moving at a constant speed.
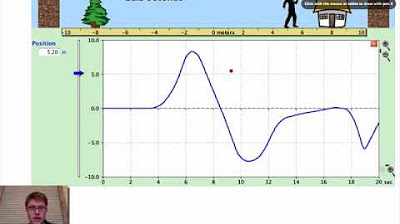
- 📊 A position versus time graph (X vs T) can be used to visually represent the motion diagram.
- 🔍 A straight line on the X vs T graph indicates constant velocity and thus zero acceleration.
- 🌐 Understanding and plotting these graphs are crucial for analyzing and making sense of an object's motion.
Q & A
What is the purpose of a motion diagram?
-A motion diagram is used to visualize the movement of objects in the universe, such as a person running.
What would a stroboscopic picture of a person running look like?
-A stroboscopic picture would capture the person at different positions at various intervals, showing the progression of their movement over time.
How does one determine the direction of motion in a motion diagram?
-The direction of motion is determined by deciding which way is positive and which is negative on the diagram.
What is the significance of the spacing between positions in a motion diagram?
-The spacing between positions indicates whether the object is increasing, decreasing, or maintaining its speed.
How can we simplify the representation of motion in a diagram?
-Instead of drawing multiple images, we can use dots to represent the object's position at different times to simplify the diagram.
What does the distance covered in each time interval indicate?
-The distance covered in each time interval helps to determine the speed of the object.
How is a motion diagram related to a position-time (X vs T) graph?
-A motion diagram can be translated into a position-time graph where the X-axis represents position and the T-axis represents time.
What does a straight line on a position-time graph indicate?
-A straight line on a position-time graph indicates that the object is moving at a constant speed.
What is the acceleration of an object moving at constant velocity?
-The acceleration of an object moving at constant velocity is zero.
What information can a position-time graph provide about an object's motion?
-A position-time graph can provide information about the object's position, velocity, and acceleration over time.
Why is it important to be able to plot and interpret motion diagrams and position-time graphs?
-Plotting and interpreting these diagrams and graphs helps us understand and analyze an object's motion in terms of position, velocity, and acceleration.
Outlines
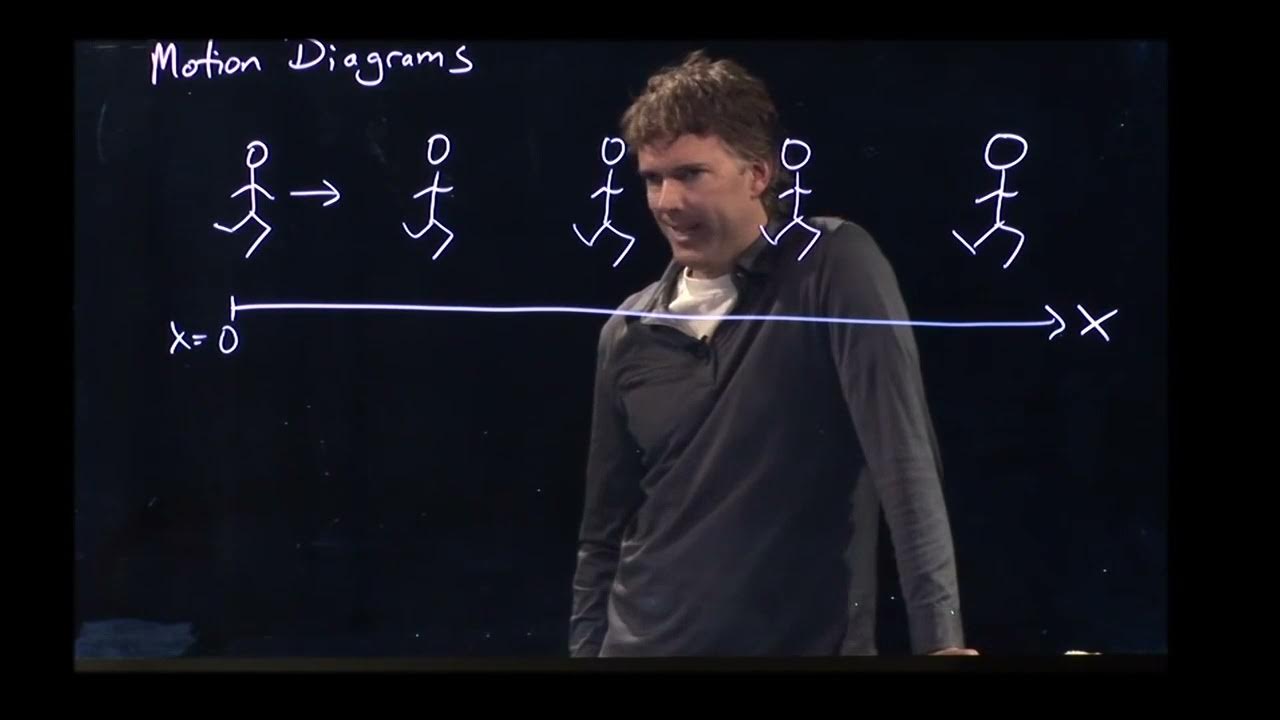
🏃♂️ Introduction to Motion Diagrams
This paragraph introduces the concept of motion diagrams as a method to visualize the movement of objects, using the example of a person running. It explains how a series of stroboscopic pictures can represent the motion over time, highlighting the importance of establishing a positive direction to analyze changes in position. The discussion then moves to how to simplify the representation by using dots and numbers to indicate positions at different times, leading to the creation of a position versus time graph. The example provided illustrates a person running at a constant speed of 10 meters per second, resulting in a straight line on the graph, indicating constant velocity and zero acceleration.
📈 Interpreting Motion Diagrams
The second paragraph delves into the interpretation of motion diagrams, emphasizing that a single graph can reveal a wealth of information about an object's motion. It explains that the graph not only shows position over time but also allows for the determination of velocity and acceleration. The example clarifies that if an object moves at a constant speed, as was the case with the runner in the previous paragraph, the acceleration is zero. The importance of plotting and understanding these diagrams is stressed, as they provide insights into the dynamics of motion.
Mindmap
Keywords
💡Motion Diagrams
💡Stroboscopic Picture
💡Position
💡Delta
💡Velocity
💡Acceleration
💡Graph
💡Time Intervals
💡Speed
💡Measurement
💡Direction
💡Constant Speed
Highlights
Introduction to motion diagrams for visualizing object movement.
Visualizing a person running through a series of stroboscopic pictures.
The concept of position change and the need to define positive and negative directions.
Interpreting the speed of an object from the motion diagram by observing the delta between positions.
Simplification of motion diagrams by using dots to represent positions at different times.
Assigning numerical values to positions and time intervals for a clearer analysis.
The observation that constant distances covered in equal time intervals indicate constant speed.
Transformation of the motion diagram into a position versus time graph (X vs T).
Understanding that a straight line in the position versus time graph indicates constant speed.
The relationship between the graph, velocity, and acceleration, with zero acceleration for constant velocity.
The importance of plotting and interpreting motion diagrams for understanding an object's motion characteristics.
The historical context of using film cameras for capturing motion in the past.
The practical application of motion diagrams in analyzing real-world movements, such as a person running.
The educational value of motion diagrams in teaching fundamental concepts of physics.
The potential for using motion diagrams to analyze more complex motion scenarios beyond constant speed.
The role of technology in simplifying the process of creating and interpreting motion diagrams.
Transcripts


5.0 / 5 (0 votes)
Thanks for rating: