How to do Linear Regression on the TI84 Plus CE
TLDRThis script offers a step-by-step guide on performing linear regression and finding the line of best fit using the TI-84 Plus CE calculator. It covers data entry, creating a scatter plot, adjusting axes, and interpreting the regression equation. The process includes enabling diagnostic features for accurate results and visually plotting the line on the scatter plot. The explanation is detailed, ensuring users understand how to utilize the calculator for statistical analysis.
Takeaways
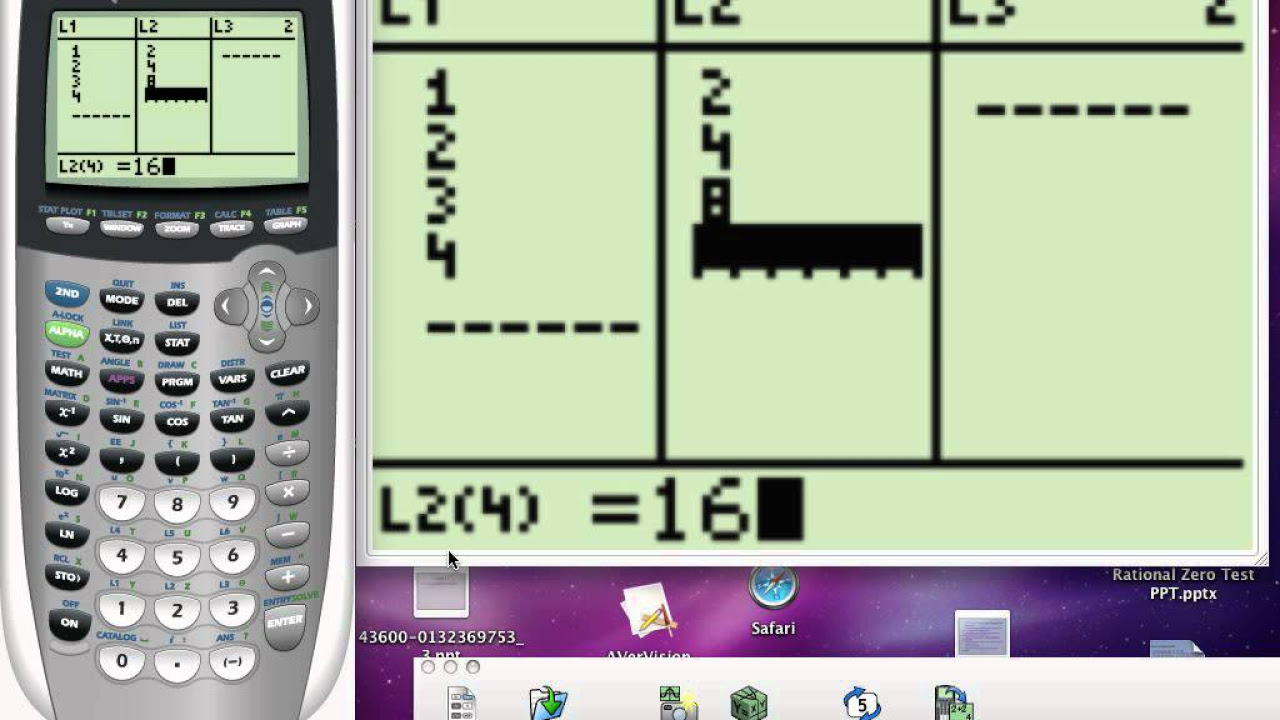
- 📝 Start by entering the data into the TI-84 Plus CE calculator by pressing the 'STAT' button and navigating to 'Edit'.
- 🔍 Clear any old data from lists L1 and L2 before entering the new X and Y data points.
- 📊 Create a scatter plot graph by setting the appropriate X and Y-axis ranges based on the data and choosing the correct scale.
- 🖌️ Customize the scatter plot with the desired mark type and color, in this case, blue is selected.
- 🎯 Verify the accuracy of the data entry by using the 'Trace' feature to display coordinates of each point.
- 🔧 Ensure the 'Diagnostic' option is turned on for the linear regression analysis, which can be done through the 'Catalog' menu.
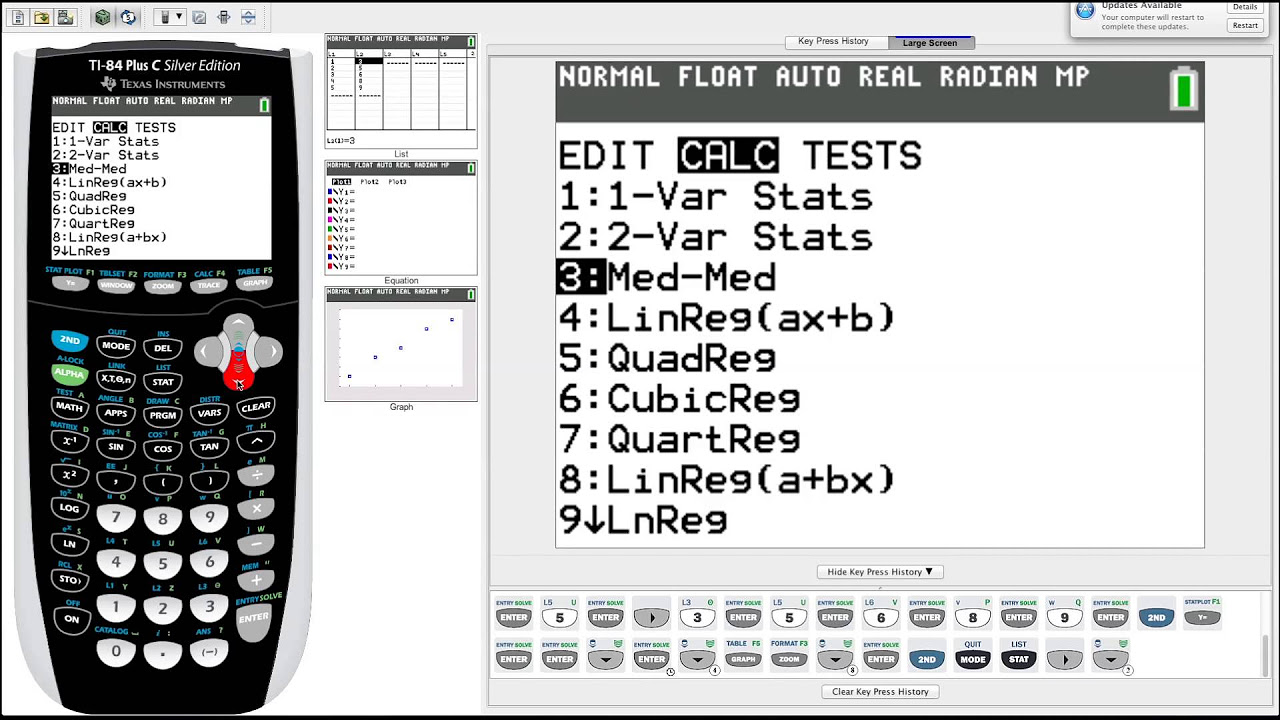
- 🧮 Perform linear regression by selecting the 'Linear Regression' calculation and confirming the data lists L1 and L2 for X and Y values.
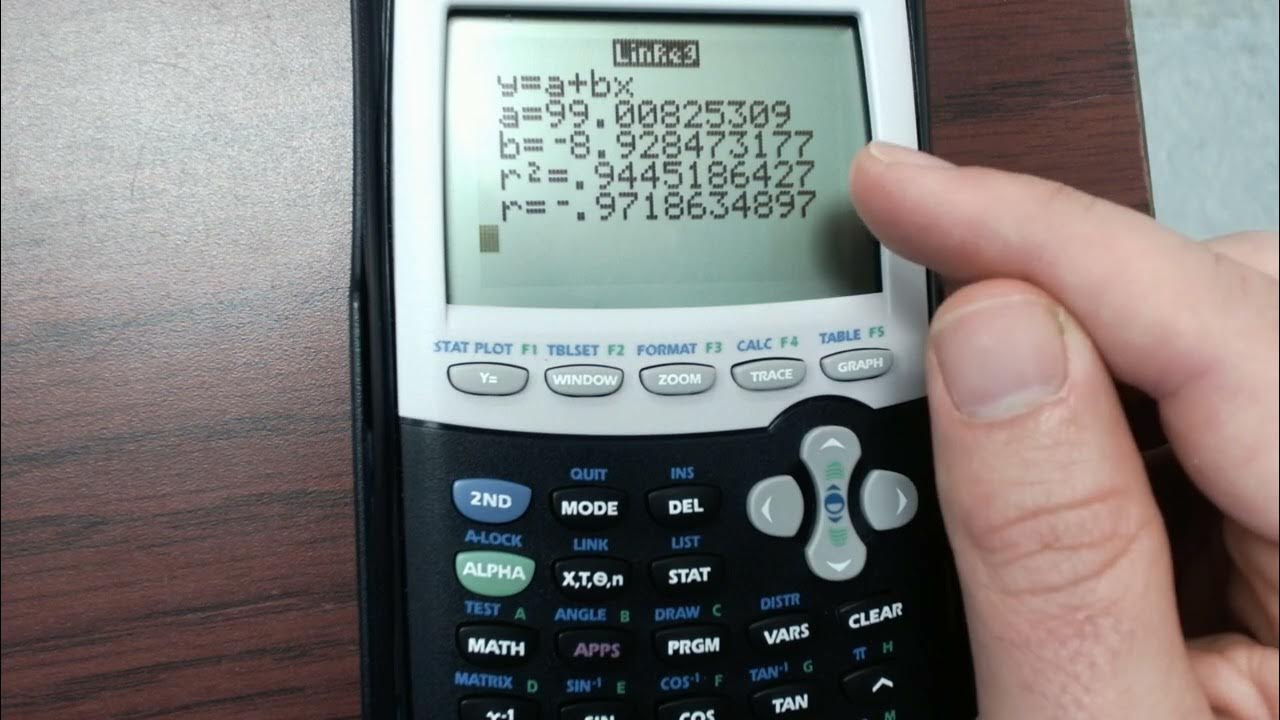
- 📈 Store the regression equation in Y1 and take note of the coefficients 'a' and 'b', as well as the correlation coefficient 'R' and 'R-squared'.
- 🏷️ Plot the line of best fit on top of the scatter plot to visualize how well the equation fits the data.
- 📝 Record the key information from the linear regression output, such as the equation (y = ax + b), for future reference or homework tasks.
- 👍 Engage with the content by giving a 'thumbs up' and subscribing to the channel for more similar tutorials and videos.
Q & A
What is the first step in performing linear regression on a TI-84 Plus CE calculator?
-The first step is to enter the data by pressing the STAT button, then number one edit to access the data entry screen.
How do you clear old data from the calculator's lists?
-To clear old data, navigate to the top of the column (L1 or L2), press the clear button, and then press enter.
What data should be entered into L1 and L2 for this linear regression task?
-The X data should be entered into L1, and the Y data should be entered into L2.
How do you set up a scatter plot graph on the TI-84 Plus CE calculator?
-Press the WINDOW button to set up the graph's window, then use the Y= button to access the Stat Plot menu, and select Plot 1 with the desired settings.
What are the X and Y range settings for the scatter plot based on the provided data?
-The X range should be set from -1 to 7, and the Y range should be set from 1 to 21.
How do you ensure that the scatter plot graph displays correctly?
-Adjust the X scale and Y scale as needed based on the scatter plot's appearance. The X scale is set to 1 in this case.
What is the purpose of the diagnostic feature in the calculator?
-The diagnostic feature provides additional information such as the correlation coefficient (R) and the coefficient of determination (R squared) for the linear regression analysis.
How do you perform the linear regression analysis on the TI-84 Plus CE calculator?
-Press the STAT button, navigate to the CALC menu, select Linear Regression, and enter the appropriate lists (L1 for X and L2 for Y). Then store the regression equation in Y1.
What is the line of best fit equation derived from the provided data?
-The line of best fit equation is Y = 2.98X + 2.05.
How do you plot the line of best fit on top of the scatter plot?
-After performing the linear regression and obtaining the equation, press the GRAPH button and the line of best fit will be plotted on the scatter plot.
What should you do if you need to revisit the regression equation during your analysis?
-Press the STAT button, navigate to the CALC menu, select Linear Regression, and then press the CALC button to view the stored regression equation.
How can you verify that the data was entered correctly?
-Use the TRACE button to display the coordinates of each point and ensure they match the entered data in L1 and L2.
Outlines
📊 Linear Regression on TI-84 Plus CE: Step-by-Step Guide
This paragraph provides a detailed walkthrough on how to perform linear regression using the TI-84 Plus CE calculator. It begins by instructing the user to enter data, clear any old data, and input the X and Y values into the calculator's lists. The user is then guided through creating a scatter plot graph, adjusting the x and y scales for clarity, and ensuring the graph's points are set up correctly. The paragraph emphasizes the importance of checking the data accuracy through the scatter plot and adjusting scales if necessary. It concludes with instructions on how to activate the diagnostic feature for the linear regression analysis, which will be used in the next steps.
📈 Storing and Plotting the Regression Equation
The second paragraph focuses on storing the linear regression equation in the calculator and plotting it on top of the scatter plot graph. It explains the process of selecting the correct lists for the X and Y data, choosing the function for the regression equation, and storing it in y1. The paragraph provides the calculated values for the regression equation (y = ax + b), with specific coefficients (a = 2.98, b = 2.05). The user is then guided through plotting the line of best fit over the scatter plot, assessing the fit of the equation to the data, and accessing the equation data for future reference. The paragraph ends with a call to action for viewers to like and subscribe to the channel for more content.
Mindmap
Keywords
💡TI-84 Plus CE
💡Linear Regression
💡Line of Best Fit
💡Correlation Coefficient
💡Stat Button
💡Scatter Plot
💡Diagnostic On
💡Y= Button
💡Stat Plot
💡Store Regression Equation
Highlights
The process begins by entering the data into the calculator's L1 and L2 lists.
Clearing old data is crucial before entering new information.
X data is entered into L1, and Y data into L2, with specific key presses detailed.
Setting up a scatter plot graph is the next step, with attention to the correct scaling of axes.
The X and Y axis scales are adjusted according to the data range.
The calculator's diagnostic feature is turned on for a more detailed analysis.
Performing linear regression involves storing the equation in Y1 for future reference.
The regression equation is derived with a specific function format (y = ax + b).
The line of best fit is plotted on top of the scatter plot for visual analysis.
The calculator's features are used to verify the correctness of the entered data.
The correlation coefficient (R) and R-squared are important outputs of the regression analysis.
The video provides a step-by-step guide on using the TI-84 Plus CE for linear regression.
The method is applicable for various tasks and homework problems.
The video is educational and designed to help viewers understand the process of linear regression on a TI-84 Plus CE calculator.
The video encourages viewers to engage with the content by liking and subscribing.
Transcripts


5.0 / 5 (0 votes)
Thanks for rating: