Describing Motion With Diagrams
TLDRThis video from the Physics Classroom's kinematics series introduces dot diagrams and velocity vector diagrams as tools for describing motion. It explains how dot diagrams represent an object's position at one-second intervals with dots, showing constant or changing speeds through equal or varying spacing. Velocity vector diagrams use arrows to depict velocity's magnitude and direction, with arrow lengths changing to indicate speeding up or slowing down. The video encourages practice in drawing these diagrams for different types of motion and provides resources for further learning.
Takeaways
- 📊 A dot diagram represents an object's position at one-second intervals with dots, useful for describing constant or changing speed motion.
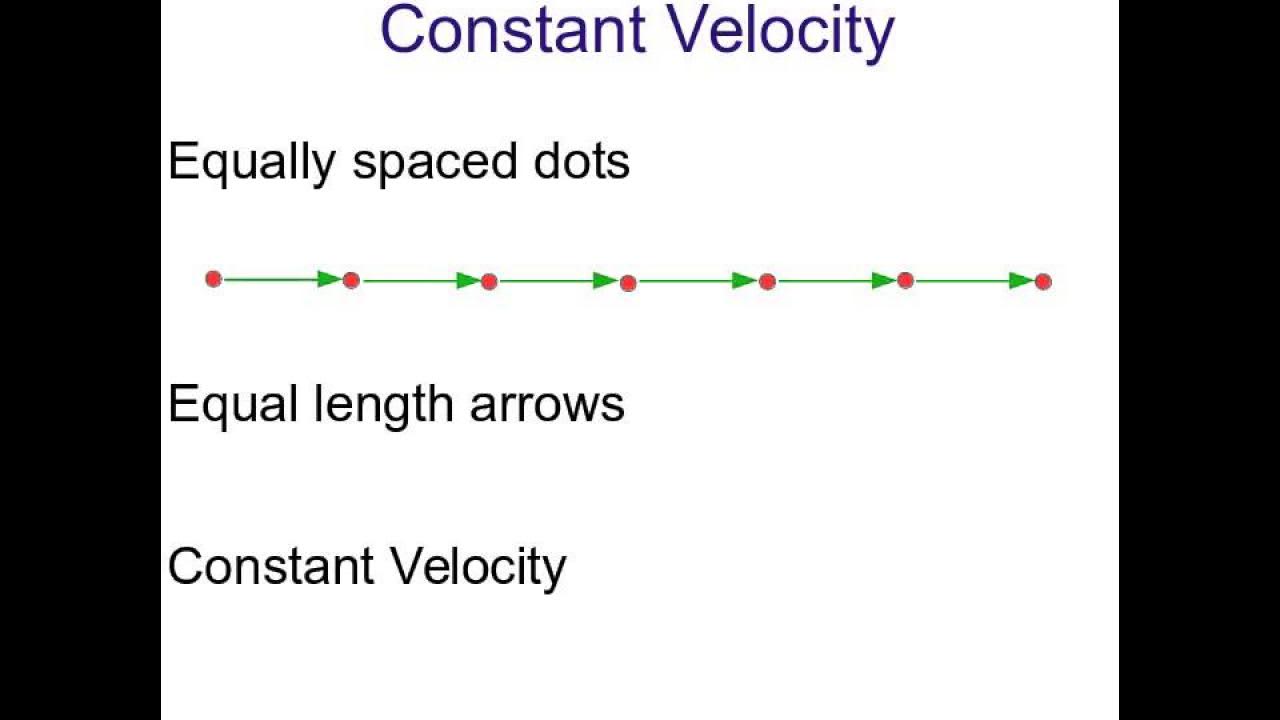
- 🚗 In constant speed motion, the dots are equally spaced, indicating the object covers the same distance every second.
- 🏎️ For speeding up motion, the dot spacing increases over time as the object travels a greater distance in each consecutive second.
- 🔄 In slowing down motion, the dot spacing decreases over time, showing the object travels a shorter distance in each consecutive second.
- 🎯 To locate a car's position in a dot diagram, the front tire is often used as a reference point.
- 🔢 The distance between consecutive dots in a dot diagram can be used to determine if the motion is constant, speeding up, or slowing down.
- 🛤️ Velocity vector diagrams use arrows to represent both the magnitude (length) and direction of velocity.
- 🌟 In constant speed motion, the length of the velocity arrows remains the same, indicating no change in speed.
- ➕ For increasing speed, the length of the velocity arrows increases over time, signifying the object is speeding up.
- ➖ In decreasing speed, the length of the velocity arrows decreases, indicating the object is slowing down.
- 📚 Practice is essential for solidifying understanding of dot diagrams and velocity vector diagrams, and resources are available for further learning.
Q & A
What is a dot diagram used for in kinematics?
-A dot diagram is used in kinematics to represent the position of an object at one-second intervals of time, showing the object's motion through a series of dots placed at the object's successive positions.
How does a dot diagram show constant speed motion?
-In a dot diagram, constant speed motion is represented by dots spaced equally apart, indicating that the object covers the same distance in each one-second interval.
How can you tell if an object is speeding up from a dot diagram?
-If an object is speeding up, the dot diagram will show increasing spacing between consecutive dots, with each subsequent dot positioned further away than the previous one, indicating the object is covering more distance with each passing second.
What does a decreasing spacing between consecutive dots in a dot diagram indicate?
-A decreasing spacing between consecutive dots in a dot diagram indicates that the object is slowing down, as it is covering less distance with each passing second.
What is a vector diagram in the context of kinematics?
-A vector diagram in kinematics is a representation that uses arrows to show both the magnitude (length of the arrow) and direction of velocity. It is used to describe the motion of an object in terms of its speed and the direction it is moving.
How does a velocity vector diagram differ between constant and changing speed motion?
-In a velocity vector diagram, constant speed motion is represented by arrows of the same length, indicating no change in velocity over time. For changing speed motion, the length of the arrows changes over time, with the arrows growing longer for speeding up and shorter for slowing down objects.
What is the significance of the direction of the arrow in a velocity vector diagram?
-The direction of the arrow in a velocity vector diagram indicates the direction of the object's motion. The length of the arrow represents the magnitude of the velocity, with longer arrows signifying faster speeds and shorter arrows indicating slower speeds.
How can you practice creating dot diagrams and vector diagrams?
-To practice creating dot diagrams and vector diagrams, you can draw them for different types of motion, such as constant speed, increasing speed, and decreasing speed, and for different scenarios like an object moving to the left or to the right. You can also label the diagrams with positions and times to further enhance your understanding.
What additional resources are suggested for solidifying understanding of dot and vector diagrams?
-For further practice and understanding, the video suggests using concept builders on their website, such as 'Motion Diagrams' and 'Dots and Graphs,' as well as the Minds on Physics app for practicing oil-drop representations, which are similar to dot diagrams.
How can you label positions and times on a dot diagram?
-You can label positions and times on a dot diagram by placing numerical values at the dots to indicate the object's position at specific times. For example, if an object moves at a constant speed, you would place equal distances between the labeled positions, corresponding to the time intervals.
Outlines
🚗 Introduction to Dot and Vector Diagrams in Kinematics
This paragraph introduces the concept of dot diagrams and vector diagrams in the context of kinematics. It explains that dot diagrams represent an object's position at one-second intervals with dots, and how these dots can illustrate constant speed, accelerating, or decelerating motion. The explanation includes a comparison between constant speed (equal spacing between dots), speeding up (increasing spacing), and slowing down (decreasing spacing). The paragraph also transitions into a practice exercise for the viewer to draw dot diagrams for objects moving to the left with varying speeds.
🏁 Velocity Vector Diagrams and Their Interpretation
This paragraph delves into velocity vector diagrams, which are used to represent both the magnitude and direction of velocity. It clarifies that the length of the arrow on the diagram indicates the speed, while the direction shows the velocity's orientation. The paragraph contrasts constant speed motion (unchanging arrow length) with changing speeds, where the arrow length increases for speeding up and decreases for slowing down. A practice exercise is provided for the viewer to construct vector diagrams for a car moving to the left with constant, increasing, or decreasing speed.
📝 Labeling Dot Diagrams and Action Plan for Further Learning
The final paragraph discusses the addition of labels to dot diagrams for position and time, using two examples of objects moving to the right and left with specified speeds and durations. It then offers an action plan for viewers to solidify their understanding of the concepts covered in the video. This includes engaging with concept builders on the video creator's website, using the Minds on Physics app for practice, and reviewing relevant tutorials for deeper comprehension. The paragraph concludes with a call to like, subscribe, and engage with the content by leaving comments or questions.
Mindmap
Keywords
💡dot diagram
💡vector diagram
💡constant speed
💡changing speed
💡reference frame
💡position
💡velocity
💡acceleration
💡deceleration
💡practice
💡action plan
Highlights
The video introduces the concept of dot diagrams and vector diagrams for describing motion in kinematics.
A dot diagram represents an object's position at one-second intervals with dots.
For constant speed motion, the dot diagram shows equal spacing between consecutive dots.
In the case of speeding up, the dot diagram shows increasing spacing between consecutive dots as the object covers more distance each second.
A slowing down motion is depicted in a dot diagram with decreasing spacing between consecutive dots, indicating a reduction in speed.
Vector diagrams use arrows to represent the magnitude and direction of velocity.
For constant speed, the length of the velocity arrows remains the same throughout the vector diagram.
When an object speeds up, the length of the velocity arrows increases over time in the vector diagram.
A slowing down object is represented by decreasing arrow lengths in the vector diagram, maintaining the direction of motion.
The video provides a practice exercise for viewers to draw dot diagrams for objects moving to the left with constant, increasing, and decreasing speeds.
The video also explains how to label dot diagrams with position and time.
Two examples are given to demonstrate how to draw dot diagrams with labeled positions and times for both rightward and leftward motion.
The video concludes with an action plan for further learning and practice, including concept builders and the Minds on Physics app.
The action plan suggests using the concept builders 'Motion Diagrams' and 'Dots and Graphs' for additional practice.
The Minds on Physics app's 'Oil Drop Representations' module is recommended for more kinematics practice.
The video encourages viewers to engage with the content by liking, subscribing, and leaving comments or questions.
Transcripts


5.0 / 5 (0 votes)
Thanks for rating: