Physics Motion Graphs
TLDRThis video lesson delves into the fundamentals of physics, focusing on motion graphs. It explains how to interpret and sketch distance-time (X-T), velocity-time (V-T), and acceleration-time (a-T) graphs for various types of motion. The lesson covers scenarios from objects at rest to those undergoing constant velocity and acceleration, highlighting the relationship between these physical quantities and their graphical representations. Understanding these concepts is crucial for analyzing motion in physics.
Takeaways
- 📈 Understanding distance-time (X-T), velocity-time (V-T), and acceleration-time (a-T) graphs is crucial in physics to analyze motion.
- 📊 The distance-time graph (X-T) can provide the distance at any given time and the average velocity from the slope of the line.
- 🚀 Instantaneous velocity can be determined from the slope of the tangent line to the curve on the distance-time graph if the line is not straight.
- 🏃♂️ Velocity-time graph (V-T) shows the velocity at any given time and the average acceleration from the slope of the line.
- 📐 The area between the velocity-time line and the time axis represents the displacement of the object.
- 📉 Acceleration-time graph (a-T) provides the acceleration at any given time and is the most limited graph in terms of the information it provides.
- 🧘 An object at rest will have a horizontal line on the X-T graph, a horizontal line on the V-T graph at zero velocity, and a horizontal line on the a-T graph at zero acceleration.
- 🛤️ An object moving at constant velocity will have a straight line on the X-T graph with a positive slope, a horizontal line on the V-T graph indicating constant velocity, and no acceleration on the a-T graph.
- 🔼 An object moving away with constant acceleration will have a curved line on the X-T graph, a straight line with a positive slope on the V-T graph, and a horizontal line with a positive acceleration value on the a-T graph.
- 🔽 An object moving toward with constant acceleration will have a straight line with a negative slope on the X-T graph, a straight line with a negative slope on the V-T graph, and a horizontal line with a negative acceleration value on the a-T graph.
- 📉 Constant deceleration away from the origin will result in a curve with decreasing slope on the X-T graph and a negatively sloped line on the V-T graph.
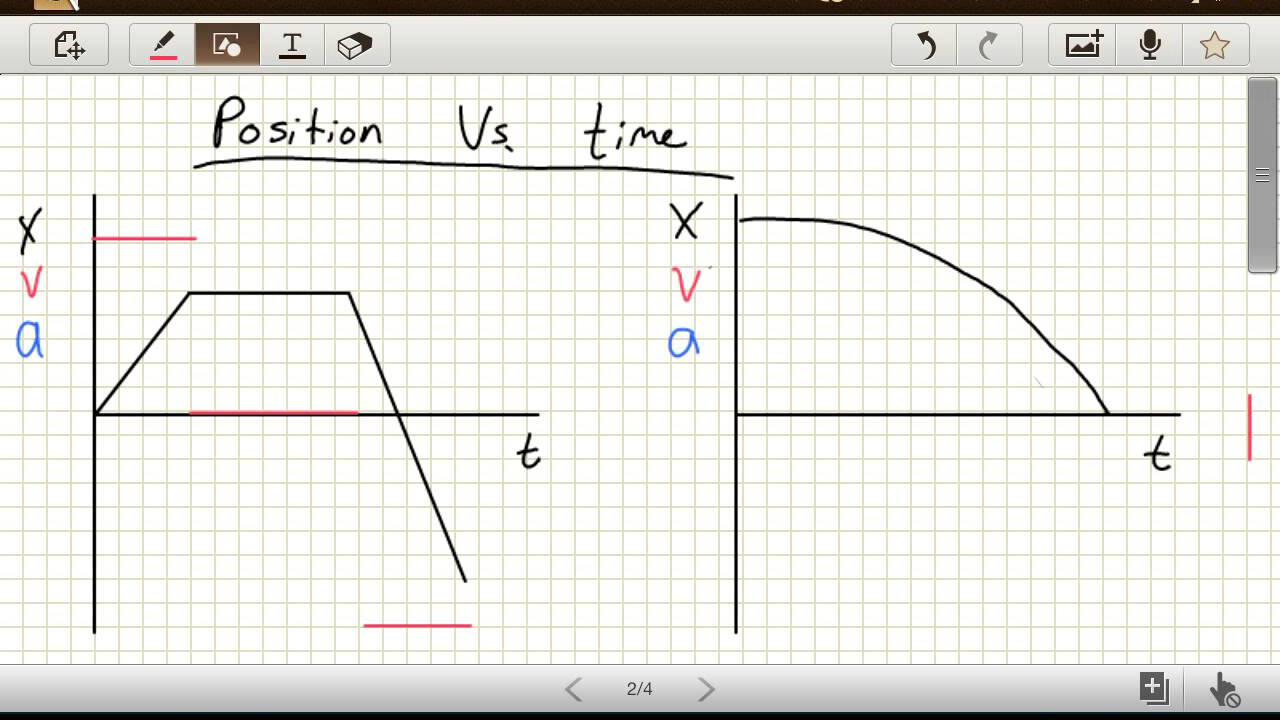
- 🚀 An object thrown straight up and returning to the thrower's hand will have a combination of constant acceleration away and toward, with a hill-shaped curve on the X-T graph, indicating a change from increasing to decreasing velocity on the V-T graph.
Q & A
What is the primary objective of the lesson on physics and motion graphs?
-The primary objective of the lesson is to understand the relationships between distance, time, velocity, and acceleration as depicted in motion graphs and to be able to sketch these graphs for the major types of motions covered in the course.
What do we represent with the symbol 'X' in the context of motion graphs?
-In the context of motion graphs, 'X' represents distance, displacement, or position, which are all synonymous when referring to the graphs.
How can we determine the distance traveled at a given time from a distance-time graph?
-To determine the distance traveled at a given time from a distance-time graph, you locate the point on the time axis corresponding to that time, then move up to the best-fit line and across to the vertical axis to find the distance traveled.
What is the significance of the slope in a distance-time graph?
-In a distance-time graph, the slope of the straight line represents the average velocity of the object over the time interval depicted by the line.
How can we interpret a velocity-time graph where the line is above the time axis?
-A velocity-time graph with a line above the time axis indicates that the object is moving away from the point of origin, as the positive velocity signifies motion away from the starting point.
What does a straight line with a positive slope in a velocity-time graph indicate?
-A straight line with a positive slope in a velocity-time graph indicates that the object is experiencing constant acceleration, moving away from the point of origin, and its velocity is increasing at a constant rate.
How can we find the displacement of an object using a velocity-time graph?
-The displacement of an object can be found by calculating the area between the line on the velocity-time graph and the time axis.
What is the significance of a curved line in an acceleration-time graph?
-A curved line in an acceleration-time graph indicates that the object's acceleration is changing, which means the object is speeding up or slowing down at a varying rate over time.
How does the shape of the velocity graph change when an object is thrown straight up and returns to the thrower?
-When an object is thrown straight up and returns to the thrower, the velocity graph will initially show an increasing velocity (as the object moves away from the ground), then reach a peak, and finally decrease as the object falls back towards the ground.
What does a negatively sloped line in a velocity-time graph indicate?
-A negatively sloped line in a velocity-time graph indicates that the object is moving toward the point of origin, and its velocity is decreasing, which could be the case when the object is decelerating.
Outlines
📚 Introduction to Motion Graphs
This paragraph introduces the concept of motion graphs in physics, aiming to understand the relationships between distance, time, velocity, and acceleration. It explains the types of graphs that can be drawn, such as distance-time (X-T), velocity-time (V-T), and acceleration-time (a-T) graphs. The paragraph emphasizes the importance of these graphs in analyzing different types of motion and how they can provide information like distance at a given time, average and instantaneous velocity, and acceleration. It sets the stage for the detailed exploration of motion scenarios in the course.
🏃♂️ Constant Velocity Motion
This paragraph delves into the specifics of an object moving at a constant velocity. It describes how this motion is represented by a straight line with a positive slope on the distance-time graph, indicating a constant rate of change in displacement. The velocity-time graph for such motion would show a horizontal line above the time axis, signifying a constant, non-zero velocity. The acceleration, being zero, is represented by a horizontal line on the time axis. The paragraph also explains the significance of the line's position relative to the time axis in determining the direction of motion.
🔄 Object Moving at Constant Acceleration
The paragraph discusses the representation of an object moving at a constant acceleration. For an object accelerating away from the origin, the distance-time graph shows a curved line with an upward concavity, indicating increasing speed. The velocity-time graph reflects this with a positively sloped straight line, showing a constant increase in velocity. Conversely, an object decelerating (slowing down) towards the origin would have a negatively sloped line in the velocity-time graph. The acceleration-time graph, in both cases, would be a horizontal line, indicating a constant acceleration, with its position above or below the time axis indicating the direction of the acceleration.
🚀 Object Thrown Straight Up
This paragraph examines the complex motion of an object thrown straight up and returning to the thrower's hand. This motion is characterized by two distinct phases: the initial upward motion with increasing distance and decreasing velocity, and the return motion with decreasing distance and increasing velocity. The distance-time graph for this scenario would show a hill-like curve, with the object first moving away from the ground, coming to rest at the peak, and then returning. The velocity-time graph would start with a positive value, decrease to zero at the peak, and then become negative as the object falls back down. This complex motion combines elements of constant velocity and constant acceleration discussed in previous paragraphs.
Mindmap
Keywords
💡Physics
💡Motion Graphs
💡Distance-Time Graph
💡Velocity-Time Graph
💡Acceleration-Time Graph
💡Constant Velocity
💡Constant Acceleration
💡Instantaneous Velocity
💡Deceleration
💡Tangent Line
💡Displacement
Highlights
Understanding the relationships of distance, time, velocity, and acceleration through motion graphs is the main objective of this physics lesson.
The distance-time graph (X vs. T) can be used to determine the distance at any given time by using the time axis and the best-fit line.
Average velocity can be derived from the slope of the straight line on a distance-time graph, while instantaneous velocity is found from the slope of the tangent line to the curve at a specific point.
Velocity-time graph (V vs. T) provides the velocity at any given time, and the slope of the line indicates average acceleration.
The area between the velocity-time graph line and the time axis represents the displacement of the object.
Acceleration-time graph (a vs. T) shows the acceleration at any given time, with the graph being the most limited in terms of information provided.
For an object at rest, the distance-time graph is a horizontal line, and the velocity-time graph is also a horizontal line at the zero velocity mark.
An object moving at constant velocity is represented by a straight, upward-sloping line on the distance-time graph, indicating no change in velocity.
Constant velocity towards (negative direction) is shown by a negatively sloped line on the distance-time graph, with the velocity-time graph showing a horizontal line below the time axis.
Constant acceleration away from the origin is depicted by a curved, upward-sloping line on the distance-time graph, with a positively sloped line on the velocity-time graph indicating increasing velocity.
An object moving with constant acceleration towards the origin has a downward-sloping line on the distance-time graph and a negatively sloped line on the velocity-time graph, indicating decreasing velocity.
Constant deceleration away from the origin results in a curve that decreases in slope on the distance-time graph, with a negatively sloped line on the velocity-time graph showing a constant rate of decrease in velocity.
When an object is thrown straight up and returns to the thrower, the motion graph shows a hill shape, indicating the object speeds up as it moves away from the ground, slows down at the peak, and then speeds up again as it returns.
The velocity-time graph can indicate the direction of motion by the position of the line relative to the time axis: above indicates moving away, and below indicates moving towards the point of origin.
Acceleration is represented by the slope of the line on the acceleration-time graph, with a positive slope indicating acceleration away from the origin and a negative slope indicating acceleration towards the origin.
Understanding motion graphs is crucial for analyzing various types of motion scenarios, providing a visual representation of an object's movement over time.
The lesson covers the basic types of motion including rest, constant velocity, constant acceleration, and deceleration, each with its unique graph representation.
By sketching X vs. T, V vs. T, and a vs. T graphs, students can gain a comprehensive understanding of the object's motion characteristics.
Transcripts
Browse More Related Video
Graphing Motion
Position vs Time, Velocity vs Time & Acceleration vs Time Graph (Great Trick to Solve Every Graph!!)

How to Cram Kinematics in 1 hour for AP Physics 1

Equations of Motion by Graphical Method

College Physics 1: Lecture 7 - Instantaneous Velocity
How to match motion graphs in physics (more examples)
5.0 / 5 (0 votes)
Thanks for rating: