Input a table of values into a Graphing Calculator and construct a line
TLDRIn this educational video, Mr. Simone from Hannon Middle School guides viewers on how to use a graphing calculator to input x and y values, graph them, and determine the equation of a line in slope-intercept form. He demonstrates entering data into lists, turning on stat plots, and using scatter plots to visualize linear relationships. Mr. Simone also teaches how to calculate the slope and y-intercept, and how to input these values into the calculator to draw the line that represents the data. The video is designed to help students understand the process of graphing linear equations and analyzing data patterns.
Takeaways
- 📚 The video is a tutorial on how to use a graphing calculator to input x and y values and determine the line equation in slope-intercept form.
- 🔍 The script explains the process of entering data into a graphing calculator, specifically into List 1 for x values and List 2 for y values.
- 📈 It demonstrates how to graph the data using the calculator's stat plot feature, choosing a scatter plot to visualize the data points.
- 📊 The video mentions the importance of checking the data sequence and ensuring the correct relationship between x and y values before graphing.
- 👁️ The tutorial highlights the need to set the graphing window appropriately for the data to be displayed correctly.
- 🛠️ The script describes how to activate the stat plot and choose the correct settings for a scatter plot with specific markers.
- 📉 The video explains how to identify the linear nature of the data by observing the graph and the slope of the line.
- 🔢 The process of finding the slope and y-intercept from the graphing calculator is detailed, using the 'calc' function.
- 📝 The tutorial advises writing down or memorizing the calculated slope and y-intercept for further use.
- 📐 It shows how to input the slope and y-intercept into the 'y=' function of the calculator to draw the line that represents the data.
- 🔄 The video also covers how to change the data in the lists and recalculate the slope and y-intercept for a new set of data.
Q & A
What is the main purpose of the video?
-The main purpose of the video is to demonstrate how to input x and y values into a graphing calculator to graph linear data tables, find the line equation in slope-intercept form, and understand the relationship between the data points.
What are the two lists in the calculator used for?
-List one is used to represent the x values, and list two is used to represent the y values for the data points that are going to be graphed.
How does the video guide the process of entering data into the calculator?
-The video instructs the user to go to 'Stat Edit' and enter the x values into list one and the y values into list two, with the cursor indicating the current position for data entry.
What is the significance of the number next to list L2 when entering values?
-The number next to list L2 indicates the sequence number of the value being entered, helping the user keep track of their position in the list.
Why is it necessary to check the relationships between the entered values?
-Checking the relationships ensures that the data points correspond correctly with each other on the x and y axes, which is crucial for accurate graphing and analysis.
What does the video suggest doing before graphing the data?
-The video suggests turning on a stat plot to visualize the data points and ensure that the scale or window for the graph is appropriate before graphing.
How does the video describe turning on the stat plot?
-The video explains to go to 'Stat Plot', ensure that the first option is highlighted, and press enter or 1 to turn it on, which will display the data points in a scatter plot format.
What is the difference between a scatter plot and a line graph in the context of the video?
-A scatter plot shows individual data points, while a line graph connects those points to show a trend. The video allows the user to switch between these views to better understand the data.
How does the video guide the user to find the slope and y-intercept of the line?
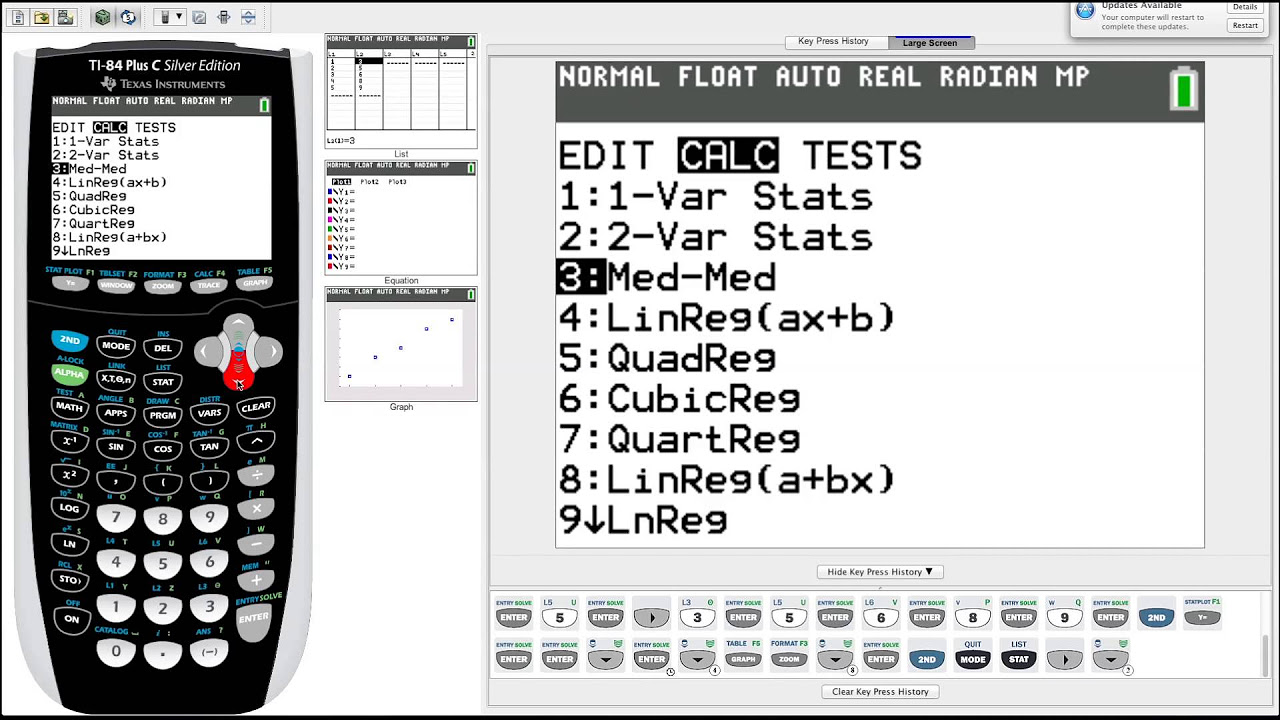
-The video instructs the user to go to 'Stat', then 'Calc', and select the fourth option to calculate the slope (a) and y-intercept (B) using the entered data from lists one and two.
What is the significance of the slope and y-intercept in the context of the video?
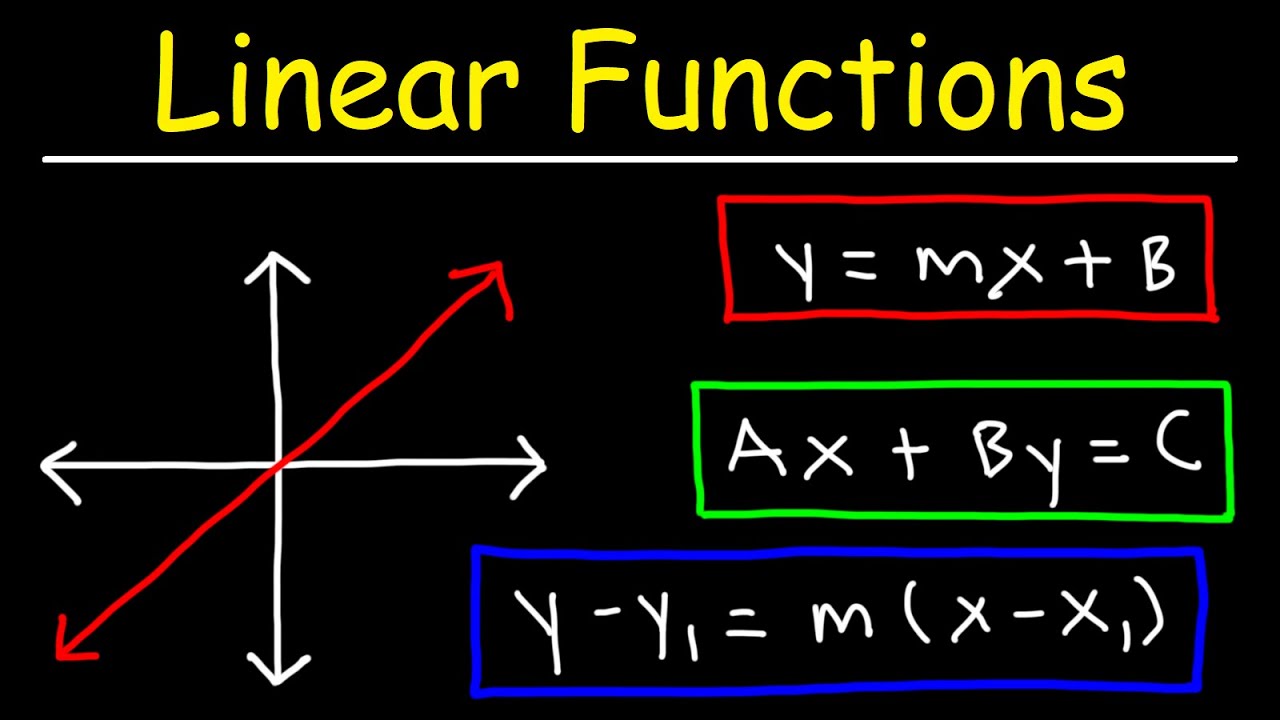
-The slope and y-intercept are the key components of the equation in slope-intercept form (y = ax + b), which represents the line that best fits the graphed data points.
How does the video demonstrate changing the graph to reflect a new set of data?
-The video shows how to clear out list two and input a new set of y values, then recalculate the slope and y-intercept, and redraw the graph with the updated equation.
Why is it important to double-check the new list after changing the values?
-Double-checking ensures that the new data is entered correctly and corresponds with the x values, which is necessary for accurate graphing and analysis.
Outlines
📊 Graphing Linear Data with a Calculator
In this segment, Mr. Simone from Hannon Middle School introduces the process of using a graphing calculator to input x and y values and determine the line that represents the data. The focus is on linear data tables and how to input them into the calculator's 'stat edit' function. He explains how to enter data into list 1 for x values and list 2 for y values, and the importance of checking the sequence of values entered. Mr. Simone also discusses the necessity of enabling a stat plot to visualize the data points and how to choose the appropriate plot type and markers. He concludes by explaining how to find the slope-intercept form of the line, emphasizing the difference between 'y = mx + b' and 'y = ax + b' used by graphing calculators, and guides viewers through the process of entering this equation into the calculator.
📈 Calculating Slope and Y-Intercept for Linear Equations
This paragraph continues the tutorial by demonstrating how to calculate the slope and y-intercept of a linear equation using a graphing calculator. Mr. Simone suggests writing down or memorizing these values for reference. He then illustrates how to draw the line that fits the data points by entering the equation 'y = -3x + 4' into the calculator, using the appropriate buttons for the x variable and the constants. The video shows the line cutting through the data, confirming the accuracy of the entered equation. Mr. Simone also explains the pattern of the slope and how it relates to the change in y values as x increases. He then proceeds to clear the previous data and input a new set to show how to find a new slope and y-intercept, which in this case are 5 and -4, respectively. The video concludes with entering the new equation 'y = 5x - 4' into the calculator and verifying that the line correctly represents the data points.
Mindmap
Keywords
💡Graphing Calculator
💡Linear Nature
💡Data Tables
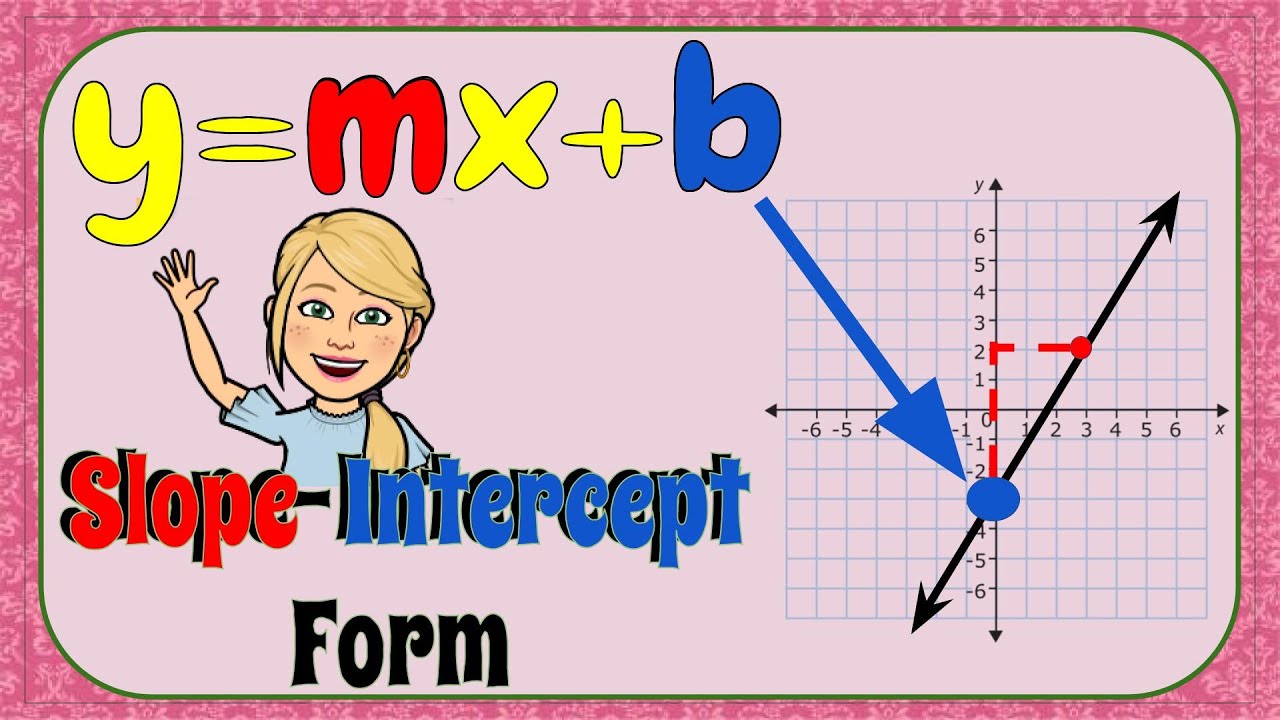
💡Slope-Intercept Form
💡Stat Plot
💡Scatter Plot
💡Marks
💡Slope
💡Y-Intercept
💡Equation
Highlights
Introduction to using a graphing calculator for inputting x and y values to determine the line representing the data.
Explanation of how to input data into a graphing calculator using the STAT EDIT function.
Demonstration of entering x values into list 1 and y values into list 2 on the calculator.
Clarification on the use of the cursor and sequence numbers when inputting values into lists.
Importance of double-checking the relationships between x and y values for accuracy.
Instructions on setting up the graphing calculator to display the graph correctly.
Explanation of turning on STAT PLOT to visualize the data points.
Different types of marks available for graphing and how to select them.
Observation of the linear nature of the data and identifying the negative slope.
Process of finding the slope-intercept form of the line using the calculator's STAT and CALC functions.
Note on the use of 'a' for slope and 'B' for y-intercept in graphing calculators.
Method to input the calculated slope and y-intercept into the y= equation to draw the line.
Observation of the line cutting through the data points, confirming the accuracy of the equation.
Explanation of the pattern in the data and how it relates to the slope and y-intercept.
Demonstration of changing data sets in the calculator and recalculating the slope and y-intercept.
Identification of a new positive slope and y-intercept from the second data set.
Final demonstration of inputting the new equation into the calculator and verifying it with the graph.
Encouragement to use the graphing calculator as a tool for homework and problem-solving.
Transcripts


5.0 / 5 (0 votes)
Thanks for rating: