TI-84 Plus Graphing Calculator Guide: Statistics
TLDRThis tutorial video series guides viewers on utilizing the TI-84 graphing calculator effectively. It begins with entering data into lists, demonstrates how to clear old data, and input new values. The video then explains how to create a scatterplot, enabling the plot and selecting appropriate lists for x and y values. It proceeds to show how to zoom in on the data using 'ZoomStat' for a better view. The main focus is on linear regression, detailing the process of fitting a linear regression line to the data and storing the equation in Y1 for graphing. The video also covers accessing basic statistical calculations such as mean, median, standard deviation, and variance through the calculator's built-in functions. Finally, it provides instructions on retrieving stored statistical values for further calculations, making it an informative resource for those looking to master the TI-84 calculator.
Takeaways
- 📊 Start by entering data into lists on the TI-84 calculator by navigating to STAT, then EDIT and clearing any existing data.
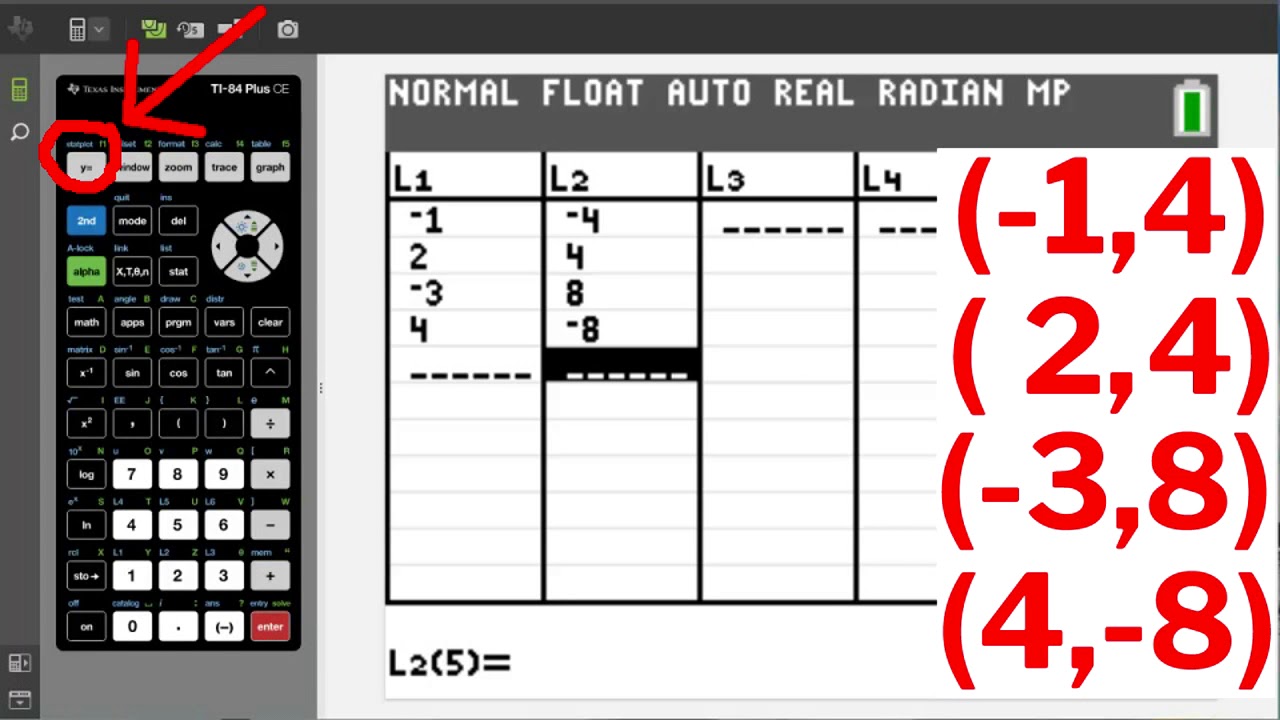
- 🔢 Enter new data points for x-values in List 1 and y-values in List 2 by typing each number and pressing ENTER.
- 📈 To create a scatterplot, go to STAT PLOT and select PLOT 1, ensuring the plot is turned ON and selecting the correct lists for x and y values.
- 🔍 Use ZOOM STAT (accessible via the ZOOM menu) to adjust the graph to fit the data on the screen perfectly.
- 📉 Fit a linear regression line to the data by accessing the CALC menu in STAT and selecting number 4 for linear regression.
- ✍️ Store the calculated linear regression equation in a Y variable (e.g., Y1) to use it for graphing.
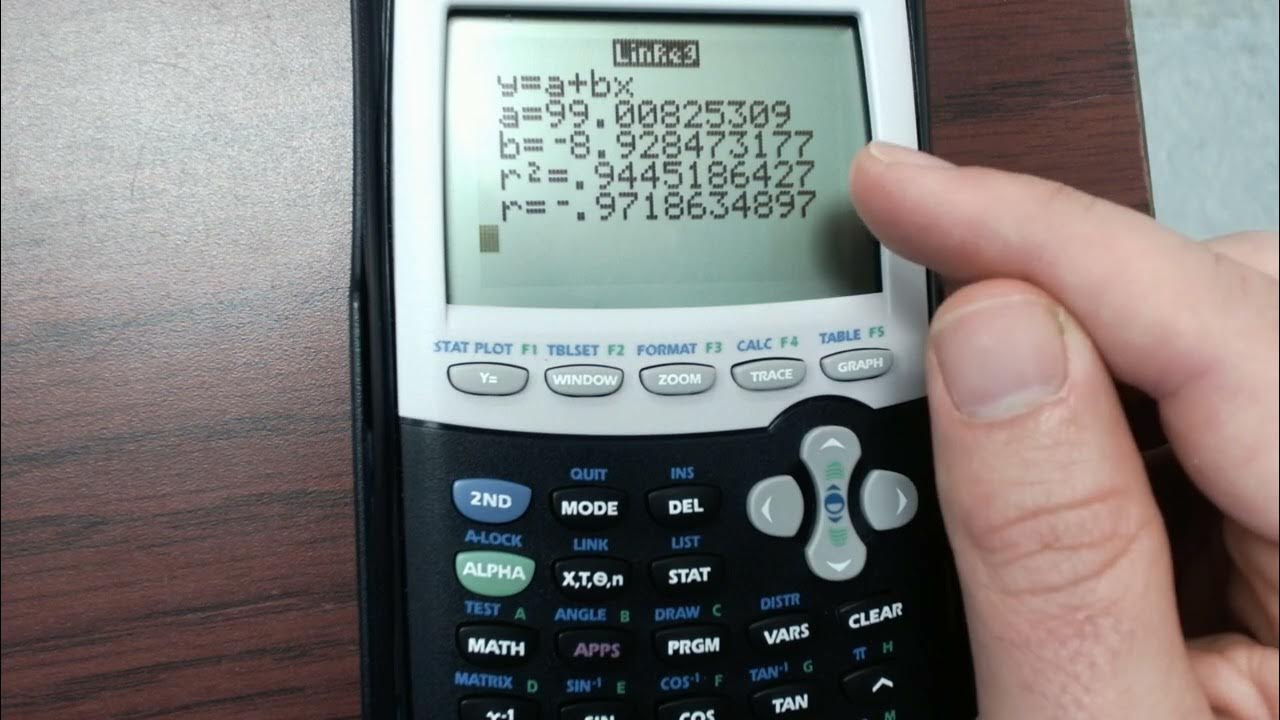
- 📐 To view the R-squared and R values, which measure the fit of the data to the line, enable diagnostics in the calculator's settings.
- 📊 Plot the regression equation onto the scatter plot by pressing GRAPH to visualize how well the line fits the data.
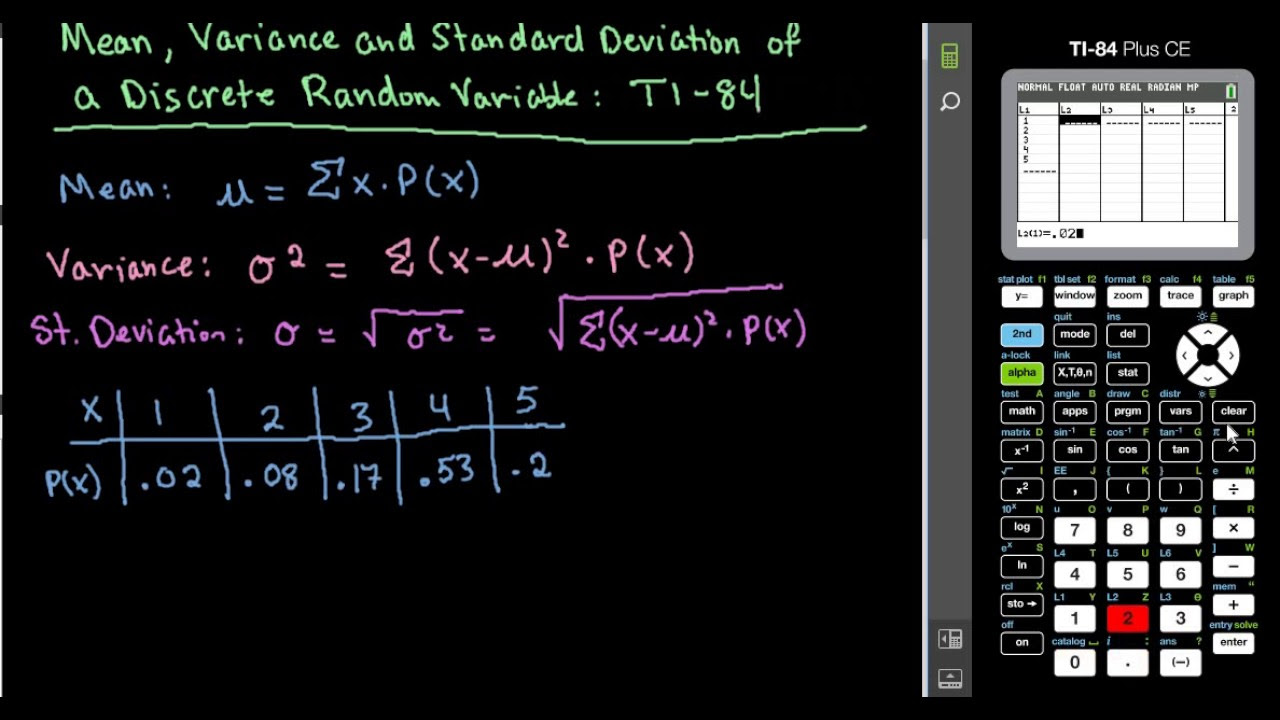
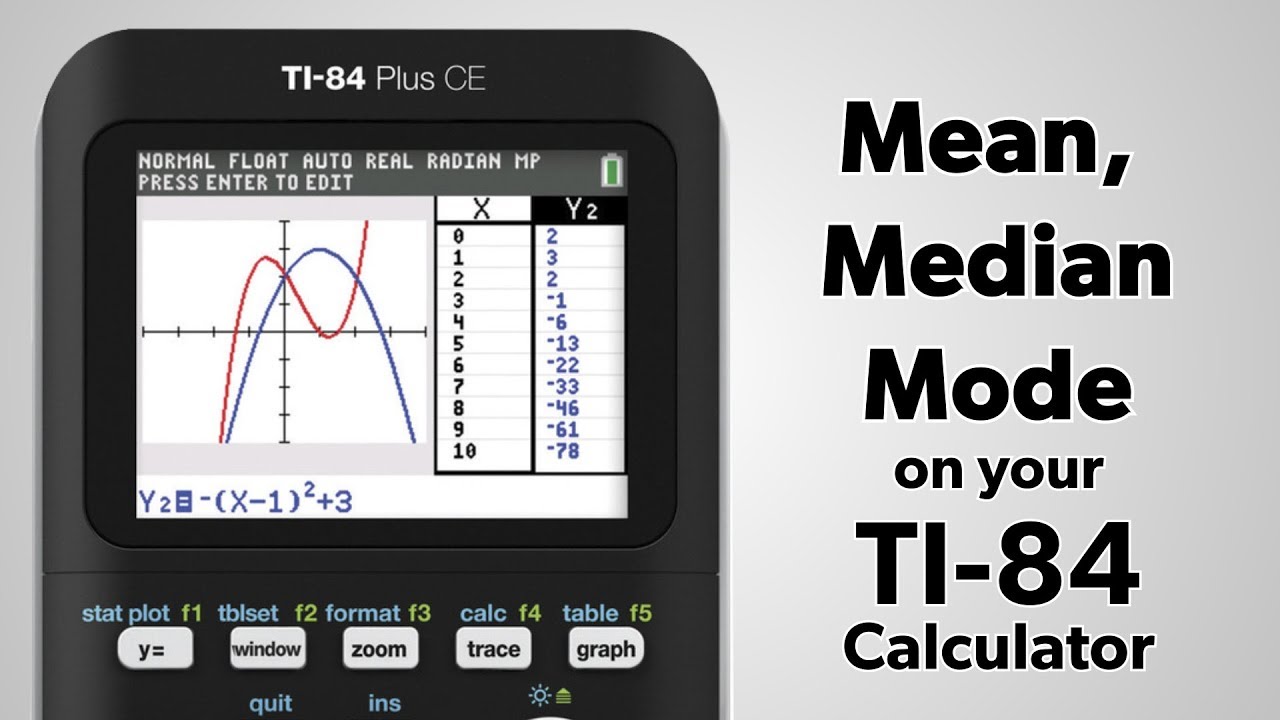
- 📊 Access various statistical measures like mean, median, standard deviation, and variance through the STAT and CALC menus.
- 🔢 Retrieve previously calculated statistics like the mean (x-bar) from the calculator's variable statistics menu for further calculations.
Q & A
How do I enter data into the lists on a TI-84 graphing calculator?
-To enter data into the lists on a TI-84, press STAT, select 1 for Edit, and then type the numbers you want to enter for your x-values in List 1 and y-values in List 2, pressing ENTER after each entry.
How can I clear old data from the lists on my TI-84 calculator?
-To clear old data, go to the Edit menu by pressing STAT, then arrow up to List 1 (or the list you want to clear), press CLEAR, and hit ENTER.
What key combination on the TI-84 calculator allows me to access the Stat Plot feature?
-To access the Stat Plot feature, press the 2nd key and then navigate to STAT PLOT.
How do I turn on the plot on the TI-84 calculator?
-Ensure that the plot is turned on by selecting Plot 1 and clicking on the 'ON' option in the settings.
What should I select for the x-values and y-values when creating a scatterplot on the TI-84?
-For the x-values, select List 1, and for the y-values, select List 2.
How can I zoom in on the data to fill the screen on the TI-84 calculator?
-Use the ZOOM command and select ZOOM STAT, which is option 9, to fit the screen perfectly to the data you have.
What is the process to add a linear regression line to a scatter plot on the TI-84?
-Go to the STAT button, navigate to the CALC menu, select number 4 for Linear Regression (LinReg), input the lists for x and y values, and choose where to store the equation, such as Y1.
How do I store the calculated linear regression equation on the TI-84?
-When prompted, choose to store the equation in a variable like Y1 by navigating to VARS, then Y-VARS, and entering it there.
What is the significance of the R-squared value in the context of linear regression on the TI-84?
-The R-squared value represents the proportion of the variance in the dependent variable that is predictable from the independent variable and is a measure of how well the data fits the line.
How can I calculate basic statistics like mean, median, and standard deviation on the TI-84?
-Navigate to the STAT menu, select CALC, and then choose 1-Var Stats to obtain statistics for one list of data.
How do I retrieve previously calculated statistics like the mean from the TI-84?
-Go to the VARS menu, then STAT, and you will be prompted with the previously calculated statistics where you can retrieve them.
Outlines
📊 Learning to Use the TI-84 Graphing Calculator
This paragraph introduces the video series on utilizing the TI-84 graphing calculator, focusing on data entry into lists. The process begins with accessing the calculator's STAT menu and editing List 1 to clear old data and input new x-values. It continues with entering corresponding y-values into List 2. The video then demonstrates how to create a scatterplot using STAT PLOT, adjusting plot settings, and using ZOOM STAT to optimize the view. The segment concludes with a tutorial on applying a linear regression to the plotted data, guiding viewers through the CALC menu to perform the regression analysis and store the resulting equation in Y1 for future graphing.
📈 Graphing Linear Regression and Calculating Statistics
The second paragraph delves into the specifics of graphing a linear regression equation on a scatter plot. It explains how to store the regression equation in Y1 and activate diagnostic features to display R-squared and R values, which measure the fit of the data to the line. The viewer is guided on how to recalculate the regression with these statistics visible. The paragraph also covers how to graph the regression line using the Y= screen and provides a step-by-step approach to accessing various statistical calculations such as mean, median, standard deviation, and variance through the calculator's STAT menu. It concludes with instructions on how to retrieve previously calculated statistics for use in further calculations.
🔢 Accessing Basic Statistics Features on the TI-84
The final paragraph emphasizes the TI-84 calculator's capability to compute basic statistics. It provides a brief overview of accessing the calculator's VARS menu and selecting statistics to perform one-variable statistics on a list of data. The paragraph explains how to navigate through the menu to choose the correct list and perform calculations, resulting in a display of various statistical measures including the mean (x-bar), sum of x, sum of x squared, sample standard deviation (SX), population standard deviation (ΣX), number of data points (N), minimum and maximum values, and quartiles. The paragraph also shows how to recall previously calculated statistics for use in other calculations, reinforcing the TI-84's utility in statistical analysis.
Mindmap
Keywords
💡TI-84 Graphing Calculator
💡Data Entry
💡Lists
💡Scatterplot
💡Zoom Stat
💡Linear Regression
💡R-squared
💡Statistics
💡One-Variable Statistics
💡Diagnostic On
Highlights
Introduction to the worldwide center-of-mass video series on using the TI-84 graphing calculator.
Demonstration of how to enter data into lists on the TI-84 calculator.
Explanation of how to clear old data from a list.
Step-by-step guide on entering new data into list 1 and list 2.
Instructions on creating a scatterplot with the entered data.
How to turn on the plot and select the type of plot.
Guidance on setting x-values to list 1 and y-values to list 2 for plotting.
Using zoom and zoom stat to fit the screen to the data.
Desire to fit a linear regression line to linear-looking data.
Process of finding and calculating the linear regression line.
Explanation of different types of regression for various data patterns.
How to store the calculated linear regression equation for graphing.
Turning on diagnostic on to calculate R-squared and R values.
Graphing the regression equation onto the scatter plot.
Calculating basic statistics like mean, median, standard deviation, and variance.
How to access one-variable statistics for data analysis.
Explanation of the statistics menu and accessing calculated values.
Conclusion and invitation to subscribe for more educational content.
Transcripts
Browse More Related Video


5.0 / 5 (0 votes)
Thanks for rating: