Position/Velocity/Acceleration Part 2: Graphical Analysis
TLDRProfessor Dave introduces viewers to graphical analysis in physics, focusing on plotting data points for variables like time, position, velocity, and acceleration. Using a detailed example of a walk in the woods, he demonstrates how to create graphs for displacement versus time, velocity, and acceleration. He explains the significance of slopes and horizontal lines in these graphs, highlighting the relationship between velocity, position, and acceleration. The video aims to enhance understanding of these physical concepts without delving into complex math, emphasizing basic graphical analysis techniques.
Takeaways
- 📊 Graphs are a powerful tool for quantitative analysis in physics, representing the relationship between two variables, often time and another physical quantity.
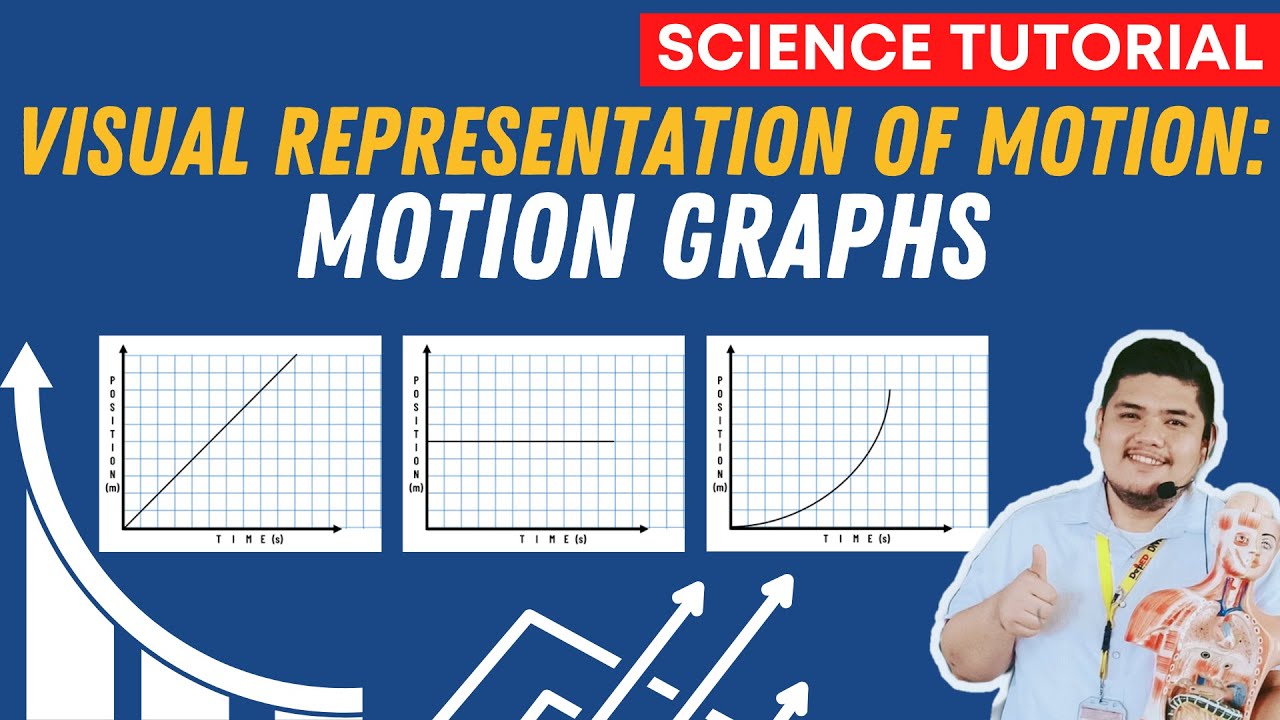
- 🕒 The x-axis typically represents time (t), with tick marks indicating seconds or multiples thereof, while the y-axis represents another variable such as position, velocity, or acceleration.
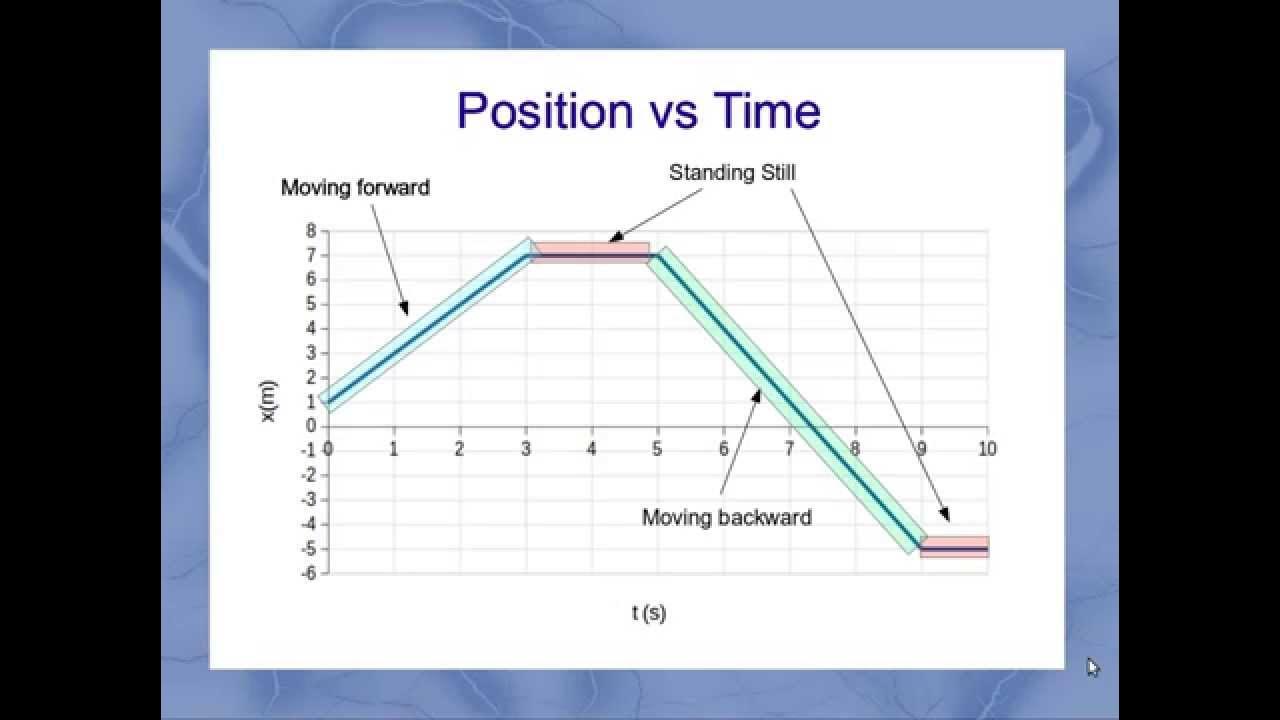
- 🚶♂️ An example scenario involves walking a path, resting, then running back partway, and finally slowing down to a stop, which can be visualized through displacement vs. time graph.
- 📈 In the displacement graph, different segments represent various activities: constant speed walking, resting without displacement, and running back at different speeds.
- 🏃♂️ The velocity graph is derived by translating the displacement graph's segments vertically to represent constant velocity, zero velocity during rest, and negative velocity when moving in the opposite direction.
- 🔄 The acceleration graph shows non-zero values only when velocity is changing, indicating the rate of change in velocity, with positive and negative values representing the direction of change.
- 🛑 Velocity is the derivative of position with respect to time, and acceleration is the derivative of velocity with respect to time, which relates the slopes of the tangent lines on the respective graphs.
- 🤔 Understanding the slope of the tangent line on a position graph gives instantaneous velocity, and the slope of the tangent line on a velocity graph gives instantaneous acceleration.
- 📚 The concepts discussed are fundamental in physics and will be further explored with calculus in more advanced studies.
- 👨🏫 Professor Dave emphasizes the importance of visualizing and analyzing these graphs to gain a deeper understanding of the physical phenomena they represent.
Q & A
What is the primary purpose of making graphs in quantitative analysis?
-The primary purpose of making graphs in quantitative analysis is to visually represent data points that correspond to two variables, which helps in better understanding and analyzing their relationships.
How is the x-axis typically labeled in physics graphs?
-In physics graphs, the x-axis is often labeled with 't' for time, and tick marks can be made for individual seconds or multiples of seconds as needed.
What variables are considered in the example given by Professor Dave?
-In the example, the variables considered are position, velocity, and acceleration.
How did the person move during the described scenario?
-The person first walked at a rate of 100 meters per minute for 10 minutes, then rested for 10 minutes, ran back at 200 meters per minute for 2.5 minutes, and finally slowed down to 50 meters per minute for the last 10 minutes.
What does the line from the origin to the point with coordinates of 10 minutes and 1000 meters represent?
-This line represents the first part of the walk where the person covered 1000 meters in 10 minutes at a constant speed of 100 meters per minute.
How is rest time represented on the graph of displacement versus time?
-Rest time is represented by a horizontal line segment, indicating no change in position while time progresses.
What is the significance of the slope in the velocity graph?
-The slope in the velocity graph indicates the rate of change of velocity over time, which reflects the acceleration or deceleration of the object.
Why is there no velocity data when the object is at rest?
-There is no velocity data when the object is at rest because velocity is zero during rest, meaning there is no displacement over that time period.
How does the acceleration graph relate to changes in velocity?
-The acceleration graph shows non-zero values only when there is a change in velocity. Positive acceleration indicates the start of movement, while negative acceleration indicates slowing down or stopping.
What is the relationship between position, velocity, and acceleration in calculus terms?
-In calculus terms, velocity is the derivative of position with respect to time, and acceleration is the derivative of velocity with respect to time.
What can the slope of the tangent line on a position graph tell us?
-The slope of the tangent line on a position graph gives us the instantaneous velocity at that point in time.
How can we analyze the graphs for better understanding?
-By analyzing the position, velocity, and acceleration graphs, we can understand the motion of an object over time, including its speed, direction, and changes in those aspects.
Outlines
📊 Introduction to Graphical Analysis and Position vs. Time Graphs
Professor Dave introduces the concept of graphical analysis as a method for quantitative analysis, emphasizing the use of graphs to plot data points corresponding to two variables, often time and another physical quantity like position, velocity, or acceleration. The example of a walk in the woods is used to illustrate how to represent different stages of motion (walking, resting, running, and slowing down) on a displacement versus time graph. The professor explains the significance of the x-axis (time) and y-axis (position), and how to represent constant speed, rest, and variable speed on the graph. The explanation includes the concept of the tangent line representing velocity and the need for a more accurate representation involving acceleration and deceleration in real-world scenarios.
🚀 Understanding Velocity and Acceleration Graphs
The second paragraph delves into the representation of velocity and acceleration on their respective graphs over time. It explains that velocity data is only available when there is motion, and similarly, acceleration data is present when velocity changes. The paragraph describes how positive acceleration corresponds to the start of movement, and negative acceleration to slowing down or stopping. The concept of velocity being the derivative of position with respect to time and acceleration being the derivative of velocity with respect to time is introduced, linking back to the concept of slopes on the position and velocity graphs. The paragraph concludes with an encouragement to focus on understanding how to draw and analyze these graphs for basic physics concepts without the complexity of calculus.
Mindmap
Keywords
💡graphical analysis
💡quantitative analysis
💡displacement
💡velocity
💡acceleration
💡time
💡physics
💡slope
💡tangents
💡differentiation
Highlights
One of the best ways to do quantitative analysis is to make graphs.
In physics, graphs plot data points corresponding to two variables, often time and another physical quantity.
The x-axis can represent time, with tick marks for seconds or multiples of seconds.
The y-axis represents another variable, such as position, velocity, or acceleration.
An example is given of walking a path, resting, and then running back at different speeds.
Displacement versus time graph is represented with the origin at the starting point and lines for each section of the walk.
The line segments on the graph represent different activities such as walking, resting, and running.
The slope of the line segments indicates the speed of movement and direction.
A horizontal line segment indicates a period of rest where no displacement occurs.
Velocity is represented on the y-axis by horizontal line segments at the corresponding velocity value.
Zero velocity indicates a period of rest, and negative velocity indicates movement in the opposite direction.
Acceleration is represented by changes in velocity over time, with positive and negative values indicating changes in speed and direction.
Acceleration data is only available when there is a change in velocity.
Velocity is the derivative of position with respect to time, and acceleration is the derivative of velocity with respect to time.
The slope of the tangent line on a position graph gives the instantaneous velocity, and the slope on a velocity graph gives the instantaneous acceleration.
The tutorial focuses on basic concepts without complex math, suitable for understanding position, velocity, and acceleration graphs.
The video aims to develop the ability to draw and analyze graphs for position, velocity, or acceleration.
Transcripts
Browse More Related Video
Visualizing Motion Using Tape Charts and Motion Graphs | SCIENCE 7 QUARTER 3 MODULE 2 WEEK 3

How to Cram Kinematics in 1 hour for AP Physics 1
How Do You Graph Motion? | Physics in Motion

Velocity Time Graphs, Acceleration & Position Time Graphs - Physics

College Physics 1: Lecture 7 - Instantaneous Velocity
Interpreting Motion Graphs
5.0 / 5 (0 votes)
Thanks for rating: