10.2.6 Regression - Residual Plots and Their Interpretation
TLDRThis video tutorial delves into the significance of residual plots in regression analysis, guiding viewers on how to construct and interpret them. It uses the chocolate consumption and Nobel laureate rate dataset to illustrate the process, explaining how residuals are calculated and plotted. The video emphasizes the importance of residual plots in verifying the assumptions of linear regression, such as normal distribution and constant variance of residuals. It concludes with examples of residual plots that indicate whether a regression model is appropriate, ensuring viewers can assess the fit of their models effectively.
Takeaways
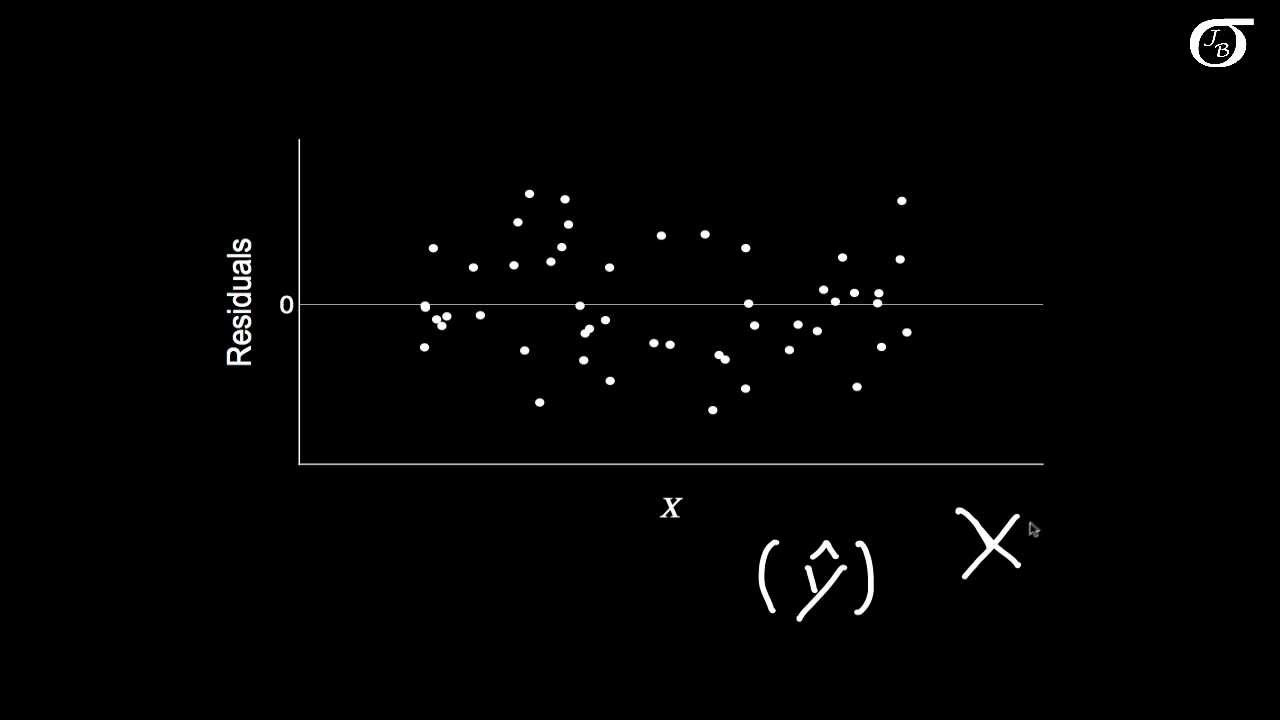
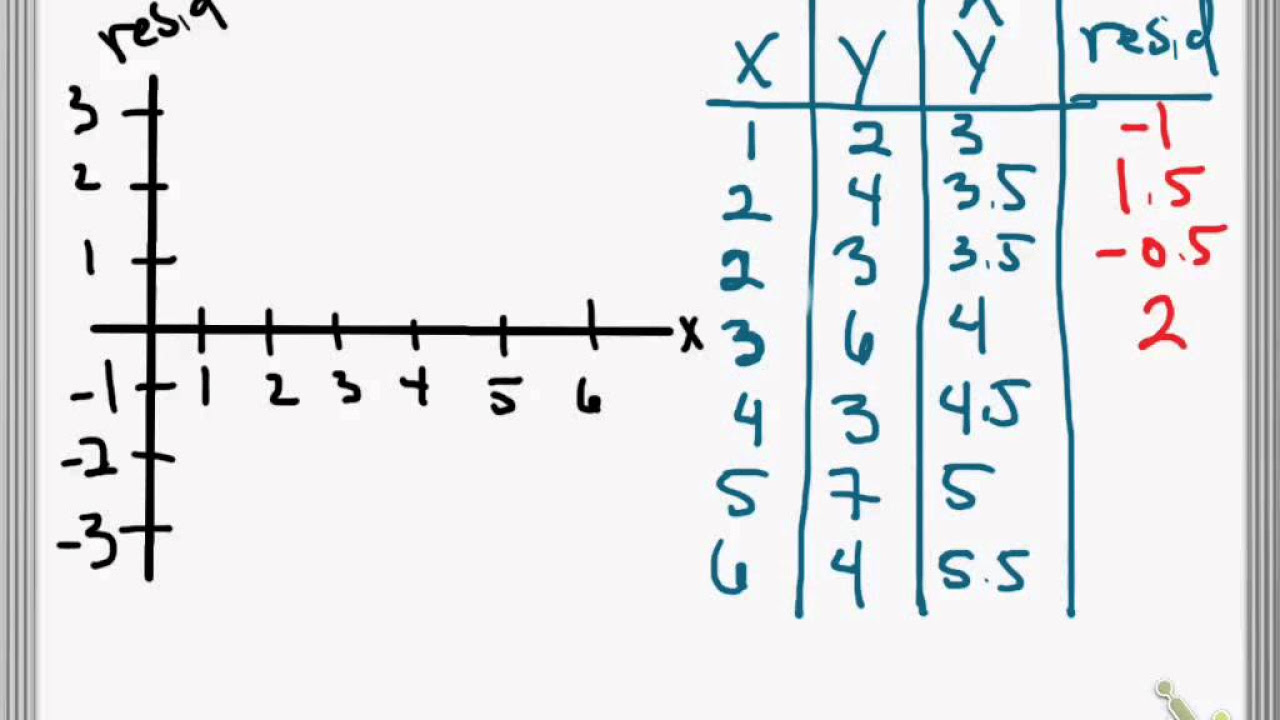
- 📊 A residual plot is a scatter plot where the y-coordinates are replaced by the residuals (y - ŷ), which is a tool to check the assumptions of a regression model.
- 📈 To create a residual plot, a horizontal line at y=0 is drawn, and points are plotted with x-values and their corresponding residuals.
- 🔍 Residual plots can be used to analyze the correlation and regression results, helping to determine if a regression equation is a good fit for the data.
- 🌐 The video uses the example of chocolate consumption and Nobel laureate rates across different countries to illustrate the concept of residual plots.
- 📉 The regression line is plotted on the scatter plot, and each data point's residual is calculated by subtracting the predicted y-value (ŷ) from the actual y-value.
- 📍 Residuals above the line are positive, and those below are negative, indicating how far each point is from the regression line.
- 📋 The formal requirements for regression analysis include that the sample is a random sample, the points in the scatter plot form an approximate straight line, and there are no outliers that are known errors.
- 🔍 The residual plot helps to verify these formal requirements by visually inspecting for patterns and consistency in the distribution of residuals.
- 🚫 An ideal residual plot should not show any obvious pattern and should not vary significantly in width from left to right, indicating equal standard deviations for different x values.
- 📉 If the residual plot shows a pattern, it suggests that the original data does not follow a straight line, and the regression equation may not be a good model.
- 📈 The absence of a pattern and consistent width in the residual plot suggests that the regression equation is appropriate, confirming the assumptions for regression analysis.
Q & A
What is the main purpose of a residual plot in the context of the video?
-The main purpose of a residual plot is to examine whether a regression equation is a good model for the data by checking the formal requirements necessary for making inferences about correlation and regression.
How is a residual plot different from a regular scatter plot?
-A residual plot is a scatter plot where each y coordinate is replaced by the residual (y - ŷ), which is the difference between the actual y value and the predicted y value (ŷ) from the regression line.
What are the steps to create a residual plot?
-To create a residual plot, first draw a horizontal line at y=0, then plot the ordered pairs of x and the residuals (y - ŷ) throughout the xy-plane.
Can you provide an example of how to use a residual plot to analyze a dataset?
-An example given in the script is the chocolate consumption and Nobel laureate rate dataset, where for each country, the chocolate consumption per capita and the Nobel laureate rate per 10 million people are plotted, and residuals are calculated to create the residual plot.
What does the regression line represent in the context of the video?
-The regression line represents the best fit line for the data points according to the regression equation, which is used to predict y values based on x values.
How does the script use the chocolate consumption and Nobel laureate rate data to explain residuals?
-The script uses specific data points from the chocolate consumption and Nobel laureate rate to demonstrate how to calculate residuals by subtracting the predicted y values (ŷ) from the actual y values.
What are the formal requirements for regression analysis that a residual plot helps to verify?
-The formal requirements include: the sample of paired data being a random sample of quantitative data, the corresponding values of y having a normal distribution for each fixed value of x, and the distributions of the corresponding y values having the same standard deviation for different fixed values of x.
How can a residual plot indicate that the regression model is not appropriate for the data?
-A residual plot can indicate an inappropriate regression model if it shows an obvious pattern or if the residuals get farther from or closer to the zero line as x values increase, suggesting that the standard deviations of y values are not the same for different x values or that the data does not follow a straight line pattern.
What does the lack of a pattern in the residual plot suggest about the original scatter plot?
-The lack of a pattern in the residual plot suggests that the original scatter plot is close enough to a straight line, which is one of the formal requirements for the regression model to be appropriate.
Why is it important to check the residuals and not just rely on the regression line equation?
-Checking the residuals is important because it provides a visual way to verify the formal requirements for regression analysis, ensuring that the model is appropriate and that the assumptions behind the regression line are met.
Outlines
📈 Introduction to Residual Plots in Regression Analysis
This paragraph introduces the concept of residual plots as a tool for evaluating the fit of a regression model. It explains that a residual plot is a scatter plot where the y-coordinates are replaced by the residuals (the difference between the observed and predicted y-values). The paragraph uses the example of chocolate consumption and Nobel laureate rates across different countries to illustrate how to construct a residual plot. It emphasizes the importance of residual plots in checking the assumptions necessary for valid inferences about correlation and regression.
📊 Constructing a Residual Plot and Analyzing Its Significance
This section delves into the process of creating a residual plot using the chocolate consumption and Nobel laureate rate dataset. It explains how to calculate the predicted y-values (y-hat) from the regression equation and then determine the residuals by subtracting these from the actual y-values. The paragraph demonstrates how to plot these residuals against the x-values, using the zero residual as a reference line. It also discusses the use of technology for these calculations and the importance of the residual plot in verifying the assumptions of linearity and constant variance in regression analysis.
🔍 Examining Residual Plots to Validate Regression Model Assumptions
The paragraph focuses on how to use residual plots to check the formal requirements of regression analysis. It outlines the three formal requirements: random sampling of data, linearity of the scatter plot, and homoscedasticity (constant variance of residuals across different x-values). The paragraph explains that a residual plot without an obvious pattern and with consistent spread across the x-values indicates that the regression model meets these assumptions. It provides examples of residual plots that suggest a good model fit and those that indicate potential issues with the model assumptions.
📚 Conclusion on Using Residual Plots to Assess Regression Models
In the final paragraph, the script wraps up the discussion on residual plots, emphasizing their utility in determining the adequacy of a regression model. It reiterates the importance of a residual plot's lack of pattern and consistent spread as indicators of a good model. The paragraph also includes examples of residual plots that suggest the model may not be appropriate due to patterns or changing spread of residuals. The video concludes with a summary of the key points and a farewell message to the viewers, wishing them success in their studies.
Mindmap
Keywords
💡Residual Plot
💡Regression Equation
💡Residual
💡Scatter Plot
💡Correlation
💡Normal Distribution
💡Standard Deviation
💡Formal Requirements
💡Outliers
💡Pattern
Highlights
The video discusses learning outcome number six for lesson 10.2 on residual plots.
The goal is to examine residual plots to determine the adequacy of a regression model and understand what they suggest about the original data.
A residual plot is defined as a scatter plot with y coordinates replaced by the residuals (y - y hat).
Residual plots are useful for checking the assumptions necessary for making inferences about correlation and regression.
To create a residual plot, a horizontal line at y=0 is drawn, and points are plotted as (x, y - y hat).
An example using chocolate consumption and Nobel laureate rate data set is provided to illustrate the process.
The regression line is derived from the regression equation and plotted alongside the data points.
Residuals are calculated by subtracting the predicted y values (y hat) from the actual y values.
A residual plot is then created by plotting the residuals against the x values.
The video explains how to interpret a residual plot for a proper regression model fit.
Formal requirements for regression analysis include random sampling, linear pattern in the scatter plot, and no outliers.
Residual plots help verify the assumptions that the y values have a normal distribution for each fixed x value and equal standard deviation across different x values.
A good model is indicated by a residual plot without an obvious pattern and consistent width from left to right.
Examples of residual plots are provided to demonstrate good and poor model fits.
A pattern in the residual plot suggests that the original data does not follow a straight line pattern.
An increasing or decreasing pattern in residuals indicates varying standard deviations for different x values.
The video concludes with a summary of how residual plots confirm the formal requirements for regression analysis.
The instructor wishes students well on their finals and encourages them to reach out for further assistance.
Transcripts
Browse More Related Video

Residual plots | Exploring bivariate numerical data | AP Statistics | Khan Academy
Simple Linear Regression: Checking Assumptions with Residual Plots
Residuals and Residual Plots

interpreting residual graphs
Checking assumptions of the linear model

What is Homoscedasticity and Heteroscedasticity and how to check it using SPSS?
5.0 / 5 (0 votes)
Thanks for rating: