Review and intuition why we divide by n-1 for the unbiased sample | Khan Academy
TLDRThe video script delves into the concept of estimating population variance using sample data. It explains the difference between a biased and an unbiased estimate of variance, highlighting the importance of using 'n minus 1' in calculations for the latter. The script provides a visual intuition for why dividing by a smaller number (n-1) in the sample variance formula can give a more accurate reflection of the true population variance, emphasizing that the unbiased estimate accounts for the sample mean's position within the data set.
Takeaways
- 📊 Understanding the difference between a population and a sample is fundamental, with the population (capital N) being the entire dataset and the sample (lowercase n) being a subset of it.
- 🎯 The mean of a population is a parameter denoted by the Greek letter mu (μ), calculated by summing all data points and dividing by the total number of points (N).
- 📈 The sample mean, denoted by x-bar, is calculated similarly to the population mean but using the data points from the sample (n) and dividing by the sample size.
- 🔢 Variance for a population is denoted by the Greek letter sigma squared (σ²) and is the mean of the squared distances from the population mean.
- 🔄 Sample variance can be calculated in two ways: the biased estimator (dividing by n) and the unbiased estimator (dividing by n-1).
- 🧠 The biased sample variance might underestimate the true population variance because the sample mean is always within the data and might not accurately represent the population mean.
- 📉 Dividing by n-1 instead of n in the calculation of sample variance gives an unbiased estimate, which tends to be a better approximation of the population variance.
- 🤔 The intuition behind dividing by n-1 is that it accounts for the fact that the sample mean is part of the sample and not an external value.
- 🌟 The unbiased estimate is generally preferred when trying to infer properties of the population from a sample because it doesn't assume the sample mean is known.
- 💡 The video script suggests that in the future, a computer program could be used to further demonstrate why dividing by n-1 provides a better estimate of the population variance.
- 📝 It's important to clarify when discussing sample variance whether one is referring to the biased or unbiased estimate, as the context can significantly impact the interpretation of the results.
Q & A
What is the main topic of the video?
-The main topic of the video is understanding why we divide by n minus 1 when calculating an unbiased estimate of the population variance from a sample.
What is the difference between a parameter and a statistic?
-A parameter is a characteristic or measure of a population, while a statistic is a characteristic or measure of a sample. For example, the population mean is a parameter, and the sample mean is a statistic.
How is the population mean calculated?
-The population mean is calculated by summing all data points in the population and then dividing by the total number of data points (N).
How is the sample mean denoted and calculated?
-The sample mean is denoted with the letter 'x' and a bar over it. It is calculated by summing all data points in the sample and then dividing by the number of data points in the sample (n).
What is variance and how is it calculated for a population?
-Variance is a measure of how much the data points in a set vary from the mean. For a population, variance is calculated by taking each data point, subtracting the population mean, squaring the result, and then dividing by the total number of data points.
What are the two types of sample variance discussed in the video?
-The two types of sample variance discussed are the biased sample variance and the unbiased estimator of the population variance.
How is the biased sample variance calculated?
-The biased sample variance is calculated by taking each data point in the sample, subtracting the sample mean, squaring the result, and then dividing by the number of data points in the sample (n).
Why might the biased sample variance underestimate the true population variance?
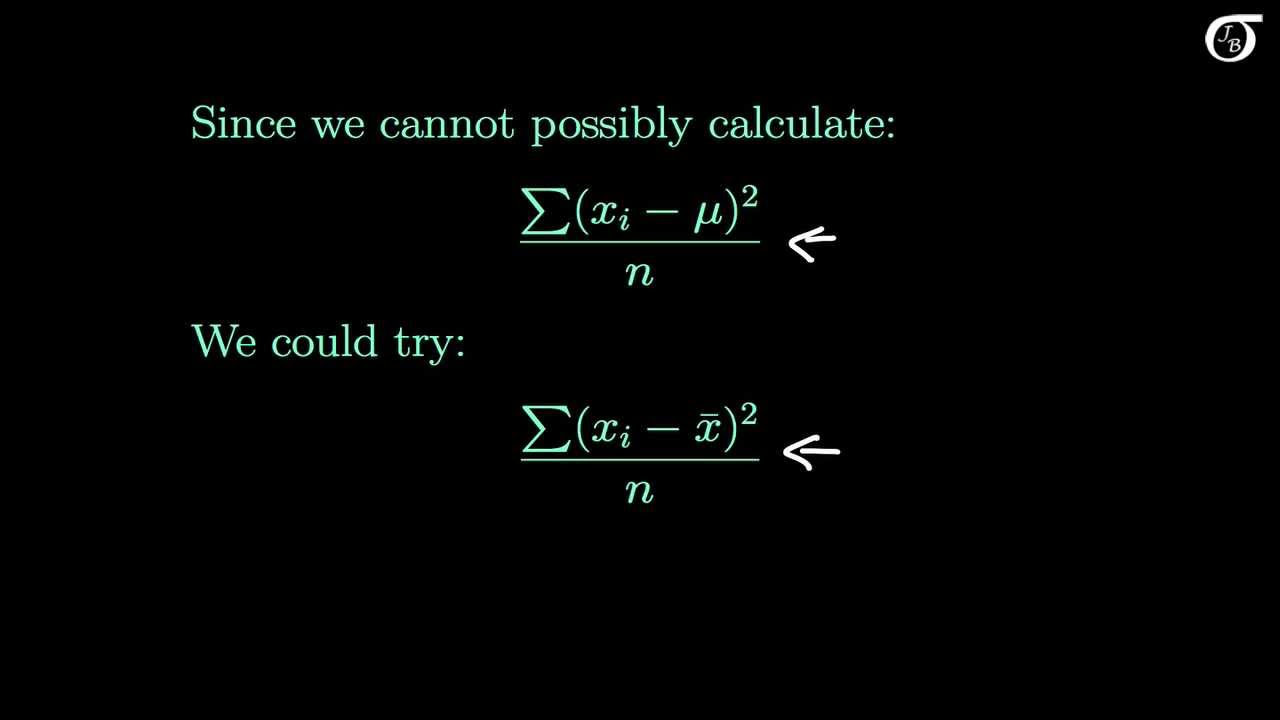
-The biased sample variance might underestimate the true population variance because the sample mean will always be within the range of the sample data points, potentially leading to smaller squared distances from the mean when compared to the actual distances from the true population mean.
How is the unbiased estimate of the population variance calculated?
-The unbiased estimate of the population variance is calculated by taking each data point in the sample, subtracting the sample mean, squaring the result, and then dividing by the number of data points in the sample minus 1 (n-1).
What is the main intuition behind dividing by n minus 1 in the calculation of the unbiased sample variance?
-Dividing by n minus 1 gives a larger value and helps to correct for the underestimation that can occur when the sample mean is used in place of the population mean, as the sample mean is always within the sample and may not fully represent the dispersion of the entire population.
What does the video suggest about the relationship between the sample mean and the population mean?
-The video suggests that the sample mean is likely to be within the range of the sample data points and may not accurately represent the true population mean, especially when the sample size is small.
What is the potential benefit of using an unbiased estimate of the population variance?
-Using an unbiased estimate of the population variance provides a more accurate representation of the true dispersion of the data points in the population, which is essential for statistical analysis and making inferences about the population based on sample data.
Outlines
📊 Understanding Population and Sample Statistics
This paragraph introduces the concepts of population and sample statistics, focusing on the mean and variance. It explains that the population mean is a parameter calculated by summing all data points in the population and dividing by the number of data points (N). Similarly, the sample mean is a statistic calculated from a subset of the population (n). The paragraph also discusses the population variance, which is the mean of squared distances from the population mean, and contrasts it with the sample variance, highlighting the difference between the biased and unbiased estimates of the population variance.
🔍 Bias in Sample Variance and the Role of n Minus 1
This paragraph delves into the concept of bias in the calculation of sample variance. It explains why dividing by n (the number of data points in the sample) instead of n-1 can lead to a biased underestimate of the population variance. The key idea is that the sample mean is always within the range of the sample data points, which can lead to a smaller estimate of the variance compared to the true population variance. By dividing by n-1, the calculation provides an unbiased estimate that is more representative of the population variance, even though it results in a larger value.
Mindmap
Keywords
💡Unbiased estimate
💡Population variance
💡Sample variance
💡Sample mean
💡Population mean
💡Bias
💡n-1
💡Degrees of freedom
💡Statistic
💡Parameter
💡Squared distances
Highlights
The video aims to review and build intuition on estimating population variance from a sample.
The population size is denoted by capital N, and the sample size by lowercase n.
The mean of the population is a parameter, denoted by the Greek letter mu (μ).
The sample mean is calculated similarly to the population mean but is a statistic, denoted by x̄.
Variance for a population is calculated by taking the mean of squared distances from the population mean, denoted by σ².
Sample variance can be calculated in different ways, including biased and unbiased estimators.
The biased sample variance is calculated by dividing by the number of data points (n).
An unbiased estimate of population variance is obtained by dividing by n minus 1 (n-1) instead of n.
Dividing by a smaller number (n-1) in the calculation of sample variance yields a larger, unbiased estimate.
The intuition behind using n-1 is that the sample mean is always within the sample and may not accurately represent the population mean.
Sampling may result in a sample mean that is not representative of the true population mean, leading to an underestimation of variance.
The video suggests that a computer program could be developed to further demonstrate the effectiveness of using n-1 for unbiased estimation.
The concept of bias in estimation is introduced, explaining why an unbiased estimator is preferred.
The video emphasizes the importance of understanding the difference between a biased and an unbiased estimate of variance.
The mathematical formulas for calculating population mean, sample mean, population variance, and sample variance are presented.
The video discusses the concept of dispersion in data and how variance measures this.
The video provides a visual example of a population and sample data to illustrate the concepts of mean and variance.
The video aims to clarify common misunderstandings about the calculation of sample variance.
Transcripts
Browse More Related Video
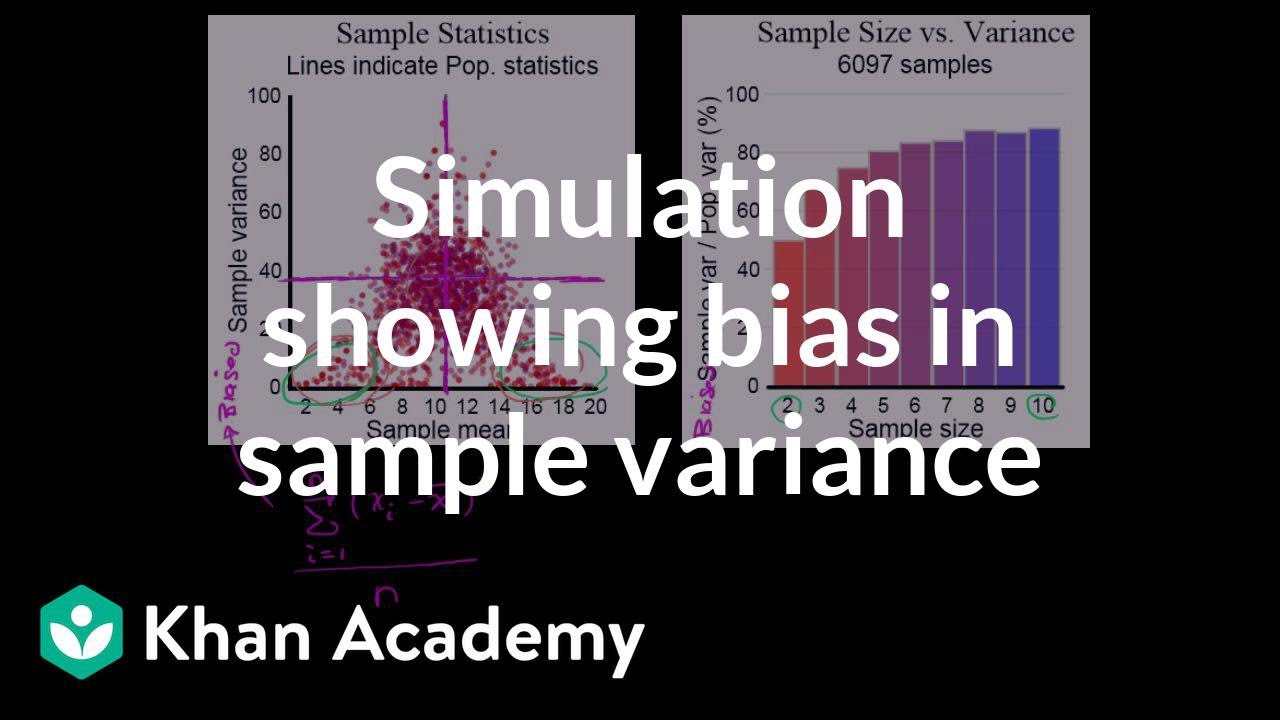
Simulation showing bias in sample variance | Probability and Statistics | Khan Academy
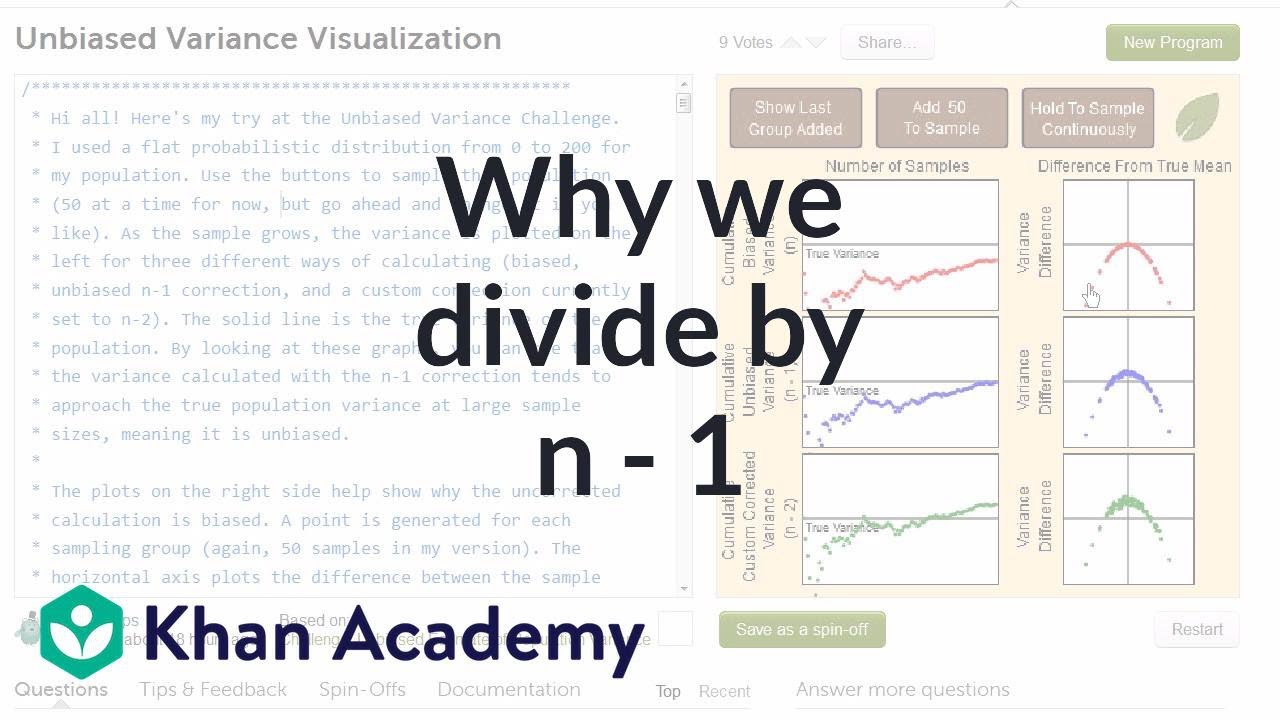
Another simulation giving evidence that (n-1) gives us an unbiased estimate of variance
Statistics: Sample variance | Descriptive statistics | Probability and Statistics | Khan Academy

Sample variance | Descriptive statistics | Probability and Statistics | Khan Academy
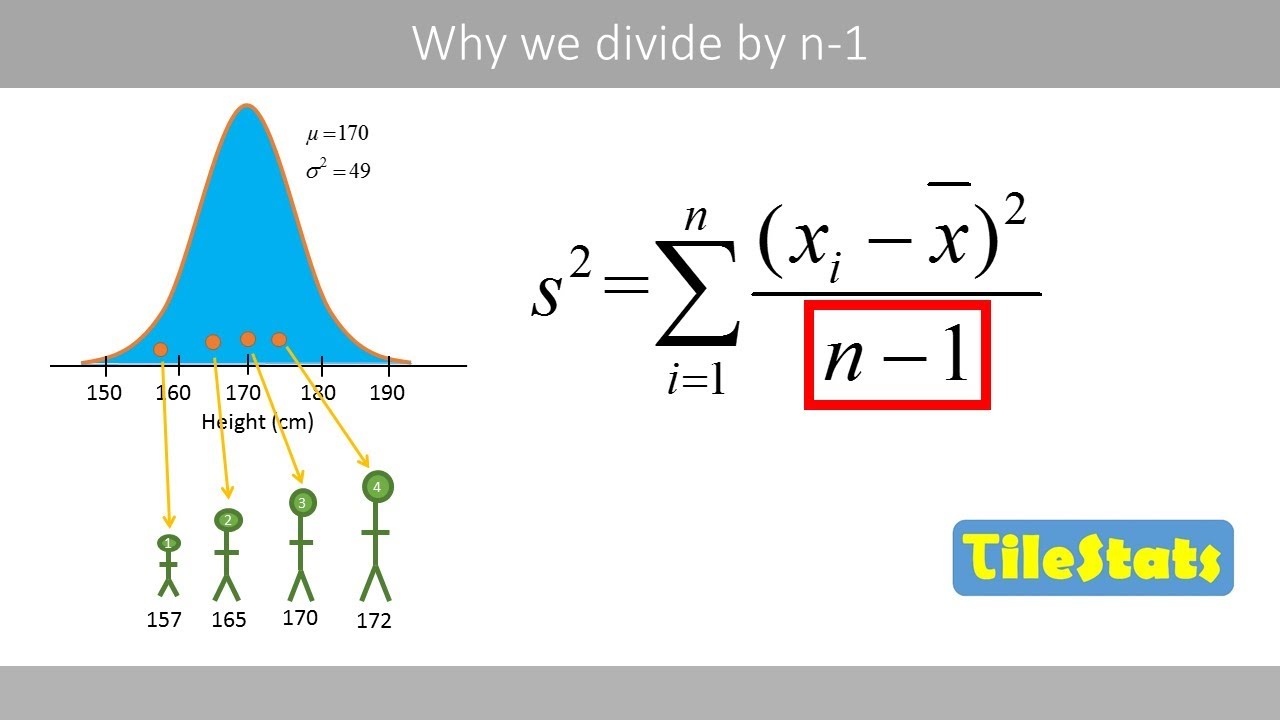
Why do we divide by n-1 and not n? | shown with a simple example | variance and sd
The Sample Variance: Why Divide by n-1?
5.0 / 5 (0 votes)
Thanks for rating: