Motion Diagrams: Acceleration and Summary
TLDRThe video script discusses the creation of acceleration vectors using motion diagrams, emphasizing the importance of understanding changes in velocity and the concept of average acceleration. It explains the process of calculating and graphically representing these vectors, using the particle model for simplification. The script also covers how to interpret motion diagrams, including identifying the direction of motion and the starting point, with an example of an object in freefall to illustrate the concept.
Takeaways
- 📈 To create acceleration vectors, use the change in velocity and represent it graphically with the same direction and length as the change in velocity vector.
- 📌 Average acceleration is defined as the change in velocity divided by the time interval, similar to average velocity which is the change in position divided by time.
- 🔄 For vector subtraction, remember that Δ (delta) represents the final value minus the initial value, and it's crucial to perform the subtraction correctly to avoid mistakes.
- 🎯 When dealing with motion diagrams, the direction of the acceleration vector is important and should be consistent with the observed motion.
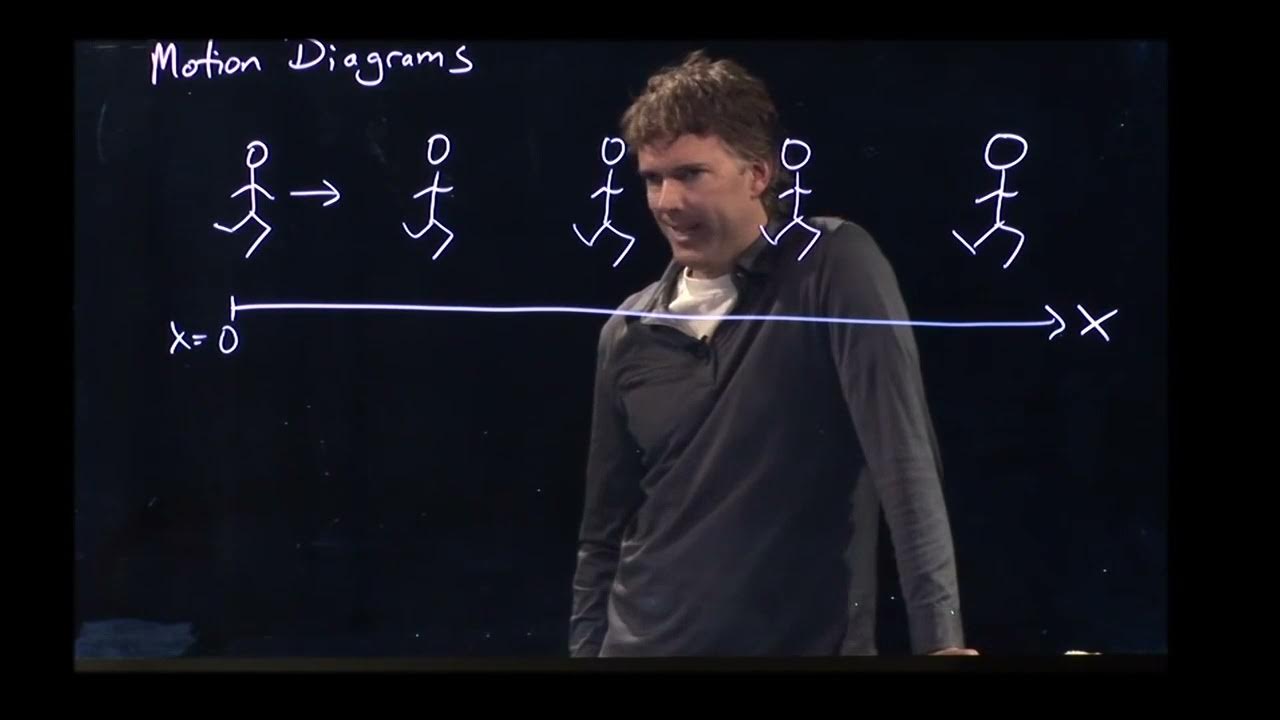
- 🚀 In motion diagrams, the particle model simplifies objects to a single dot, ignoring size, shape, or color, focusing on the position as a point.
- 🔄 Velocity vectors can be represented by the displacement between position dots, assuming a constant time interval (ΔT).
- 🌟 Average acceleration vectors are derived by subtracting two velocity vectors and are drawn to the side of a dot, indicating the change between two subsequent velocity vectors.
- 📊 When velocity is constant, acceleration is zero, and a zero vector can be used to indicate this state.
- 🏁 Motion diagrams are like video frames stacked on top of each other, with equal time intervals between each frame.
- 🔍 Interpreting motion diagrams involves understanding the direction of motion, identifying the starting point, and recognizing the type of motion, such as freefall.
- 🛑 Avoid extrapolating beyond the information provided in a motion diagram, as assumptions about events after the shown period may not be accurate.
Q & A
What is an acceleration vector and how is it graphically represented?
-An acceleration vector represents the change in velocity of an object over time. It is graphically represented by finding the change in velocity (final minus initial velocity) and drawing a vector in the same direction and length as this change, known as Delta V.
How is average acceleration calculated?
-Average acceleration is calculated by dividing the change in velocity by the time interval over which the change occurs. Mathematically, it is expressed as the difference between final and initial velocities (ΔV) divided by the time interval (ΔT).
What is the significance of the particle model in motion diagrams?
-The particle model simplifies the representation of an object in motion by considering it as a single point, disregarding its size and shape. This model is particularly useful for translational motion, as it allows us to focus on the object's position without being distracted by its physical attributes.
How do you determine the direction of the acceleration vector?
-The direction of the acceleration vector is determined by the direction of the change in velocity (ΔV). If the final velocity is greater than the initial velocity and they are in the same direction, the acceleration is in the same direction as the motion. If the final velocity is less than the initial velocity, the acceleration is in the opposite direction.
What is the relationship between velocity vectors and displacement in motion diagrams?
-In motion diagrams, the displacement between two points can be represented by a displacement vector. When considering equal time intervals, these displacement vectors can be used to determine the average velocity vector, as the displacement (change in position) divided by the time interval gives us the average velocity.
How can you graphically find the acceleration vector between two velocity vectors?
-To find the acceleration vector between two velocity vectors, you subtract the initial velocity vector from the final velocity vector. This is done by adding the negative of the initial velocity vector to the final velocity vector. The resultant vector represents the change in velocity (ΔV), which is the acceleration vector.
What does the magnitude and direction of acceleration vectors indicate in a motion diagram?
-The magnitude of the acceleration vectors indicates the rate of change of velocity, while the direction indicates the direction in which the velocity is changing. Constant magnitude and direction of acceleration vectors in a motion diagram suggest uniform acceleration.
How can you identify an object in freefall from a motion diagram?
-In a motion diagram, if you see two acceleration vectors of the same magnitude and direction, and they are directed downwards, this typically indicates an object in freefall, influenced only by gravity, starting from rest.
What is the importance of labeling vectors in a motion diagram?
-Labeling vectors in a motion diagram is crucial for clarity and understanding. It helps distinguish between velocity and acceleration vectors, and ensures that the reader knows which vectors represent the object's velocity at different points in time and the acceleration during those intervals.
How does the orientation of a motion diagram affect its interpretation?
-The orientation of a motion diagram, such as up being the positive Y-direction, affects how we interpret the motion. It's important not to rotate the diagram, as the direction indicated in the diagram corresponds to the actual direction of motion. For example, if a motion diagram is oriented upwards, it suggests that the motion is happening in the positive Y-direction.
What is the significance of the zero vector in the context of motion diagrams?
-The zero vector in a motion diagram signifies that there is no acceleration at that point, indicating that the object's velocity is constant. It's helpful for indicating states of uniform motion or the start of freefall, where the initial velocity is zero.
Outlines
🚀 Understanding Acceleration Vectors
The paragraph discusses the concept of acceleration vectors in the context of motion diagrams. It explains that acceleration is represented by the change in velocity over time, which can be calculated using the average velocity formula. The importance of using the change in velocity (final minus initial) and the vector subtraction method is emphasized. The paragraph also introduces the concept of the particle model for simplifying motion diagrams and the significance of direction in acceleration vectors.
📐 Calculating and Visualizing Acceleration
This paragraph delves deeper into the calculation and visualization of acceleration vectors. It outlines the process of vector subtraction to find the change in velocity (Delta V) and how this is translated into an acceleration vector. The paragraph also highlights the importance of directionality in acceleration vectors and introduces the concepts of parallel and perpendicular directions using unit vectors. The use of consistent colors and labeling in motion diagrams is stressed to avoid confusion.
🎥 Interpreting Motion Diagrams
The final paragraph focuses on the interpretation of motion diagrams, comparing them to frames of a video. It explains how to determine the starting point, direction of motion, and the nature of acceleration (constant or changing) from a motion diagram. The concept of freefall is introduced, with the acceleration vectors in freefall being identical and directed downwards due to gravity. The paragraph concludes with a reminder not to extrapolate beyond the information provided in the motion diagram and emphasizes the simplification of objects to points in such diagrams.
Mindmap
Keywords
💡Acceleration Vectors
💡Average Acceleration
💡Velocity
💡Vector Subtraction
💡Delta (Δ)
💡Motion Diagrams
💡Particle Model
💡Displacement Vectors
💡Freefall
💡Unit Vector
Highlights
Creating acceleration vectors can be done graphically using changes in velocity.
Average acceleration is defined as the change in velocity divided by time, similar to average velocity.
For motion diagrams, the time intervals are always the same, simplifying the process of creating acceleration vectors.
The change in velocity (Delta V) is calculated by subtracting the initial velocity from the final velocity.
Vector subtraction is performed by adding a negative vector, which changes the direction of the initial vector.
Acceleration vectors maintain the same direction and relative size in motion diagrams, even if the exact values are unknown.
The particle model simplification is used in motion diagrams to represent objects as dots, ignoring their size or shape.
Displacement vectors can be converted into velocity vectors by considering the same time interval (Delta T).
Average acceleration vectors are found by subtracting velocity vectors and are drawn to the side of a dot in a motion diagram.
Zero acceleration is indicated by a zero vector when velocity does not change.
Labeling vectors is crucial to distinguish between velocity and acceleration vectors in motion diagrams.
Motion diagrams can be used to visualize and interpret the motion of objects, such as an object in freefall.
Freefall is characterized by constant acceleration due to gravity, with initial velocity being zero.
Interpreting motion diagrams involves determining the starting point, direction of motion, and understanding the physical situation.
Objects in freefall have the same acceleration vector, representing the acceleration due to gravity.
Motion diagrams are like video frames stacked on top of each other, with equal time intervals between each point.
Average velocity and acceleration can be determined from motion diagrams by analyzing the displacement and velocity vectors.
Simplifying objects to points in motion diagrams is useful for visualizing translational motion and is applicable for most of the class content.
Transcripts


5.0 / 5 (0 votes)
Thanks for rating: