Kinematic Curves (Steps on How to Interpret/Translate Motion Graphs)
TLDRThis video tutorial demonstrates how to translate motion graphs from one type to another, using four examples from a kinematic curves worksheet. It explains the process of converting position versus time graphs to velocity and acceleration graphs, highlighting the importance of slope interpretation to determine whether the motion is accelerating or decelerating. The video simplifies complex concepts into manageable steps, making it easier for viewers to understand and apply these principles to solve similar problems.
Takeaways
- 📈 A curved position vs. time graph indicates acceleration due to its changing slope, representing the rate of motion change.
- 📉 A straight downward line in the position vs. time graph translates to a constant negative velocity and acceleration.
- 🚀 When translating a motion graph, the slope of the position vs. time graph corresponds to the acceleration shown in the acceleration vs. time graph.
- 🔄 For a graph with mixed motion (straight and curved lines), analyze each segment separately to determine the corresponding velocity and acceleration.
- 📊 A straight line in the velocity vs. time graph indicates uniform motion, either speeding up or slowing down depending on its direction and slope.
- 🔄 For complex graphs, breaking down the motion into simpler segments can simplify the translation process.
- 📈 A graph with a positive slope in the velocity vs. time indicates increasing velocity and acceleration.
- 📉 A graph with a negative slope in the velocity vs. time indicates decreasing velocity and deceleration.
- 🔄 When a graph crosses from the negative to the positive region, it signifies a change from negative to positive velocity.
- 📊 The shape and slope of the kinematic curves provide insights into the motion's velocity, acceleration, and direction of an object.
Q & A
What is the significance of a curved position versus time graph?
-A curved position versus time graph indicates that the object is accelerating because its slope is changing, which means the rate at which it is moving is changing.
How can you determine the direction of velocity from a position versus time graph?
-The direction of velocity can be determined by the upward or downward curvature of the graph. If the graph curves downward, the velocity is negative, and if it curves upward, the velocity is positive.
What is the relationship between the slope of a position versus time graph and velocity?
-The slope of a position versus time graph represents the instantaneous velocity of the object. A changing slope indicates that the velocity is changing.
How does the slope of a velocity versus time graph relate to acceleration?
-The slope of a velocity versus time graph is directly indicative of acceleration. A positive slope means positive acceleration, while a negative slope means negative acceleration.
What happens to the velocity graph when an object transitions from a curved to a straight line in the position graph?
-When an object transitions from a curved to a straight line in the position graph, the velocity graph will change from a sloping line to a horizontal line, indicating a constant velocity.
How can you determine if an object is speeding up or slowing down by looking at the velocity versus time graph?
-An object is speeding up if the line on the velocity versus time graph moves away from zero, indicating an increasing velocity. It is slowing down if the line moves towards zero, indicating a decreasing velocity.
What should the acceleration graph look like for an object with a constant velocity?
-For an object with a constant velocity, the acceleration graph should be a horizontal line at zero slope, indicating no change in velocity, which means zero acceleration.
How do you handle a velocity versus time graph with both positive and negative slopes?
-A velocity versus time graph with both positive and negative slopes should be treated as two separate problems, drawing the graph accordingly for each section and then connecting them to ensure a smooth transition.
What is the significance of the initial steepness of the position versus time graph in the context of velocity?
-The initial steepness of the position versus time graph is significant as it indicates the initial velocity of the object. A steeper slope indicates a higher initial velocity.
How does the shape of the position versus time graph affect the shape of the acceleration versus time graph?
-The shape of the position versus time graph directly influences the acceleration versus time graph. A constantly changing slope in the position graph (indicating changing velocity) results in a non-constant slope in the acceleration graph.
Why is it important to consider the entire motion when translating between kinematic graphs?
-Considering the entire motion is crucial because it ensures that all phases of the motion are accurately represented in the translation between graphs, allowing for a comprehensive understanding of the object's motion.
Outlines
📊 Translating Motion Graphs: Understanding Kinematic Curves
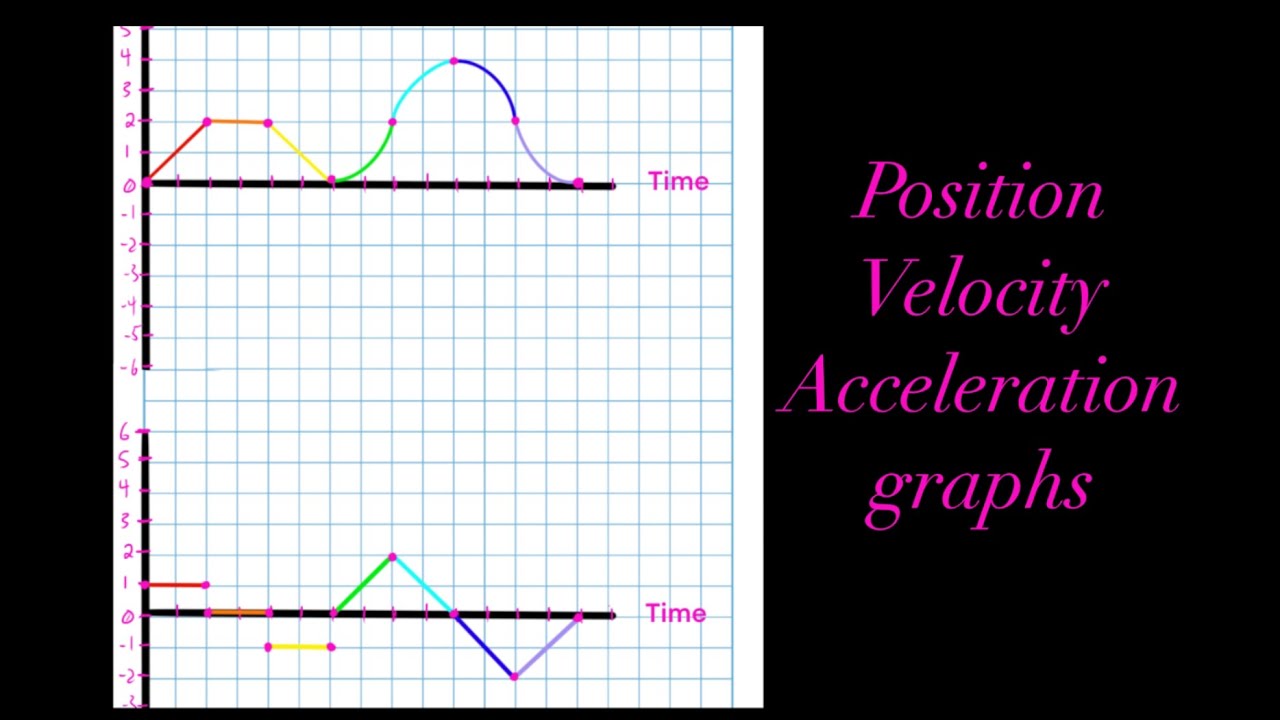
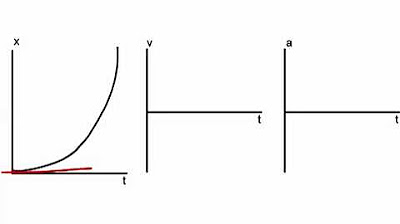
This paragraph introduces the process of translating one motion graph to another, using four examples from the stacks of kinematic curves. It explains how to analyze a position versus time graph that shows a clear curve, indicating acceleration due to the changing slope. The speaker identifies the graph's downward movement, signifying negative velocity, and translates this into a velocity versus time graph that starts below zero and is not flat, reflecting the acceleration. The paragraph further discusses the transition from a velocity graph to an acceleration graph, emphasizing that the slope of the velocity graph represents acceleration. The analysis continues with a second example that involves both a straight line and a slightly curved line, indicating different types of motion and their corresponding translations into velocity and acceleration graphs.
🏎️ Analyzing Mixed Motion: Positive and Negative Velocities
This paragraph delves into a more complex example of motion involving both positive and negative velocities. The speaker begins by examining a velocity versus time graph with all positive velocities, indicating a slowing down motion as the graph moves towards zero. The translation into a position versus time graph is then discussed, with the speaker noting the need for the slope to become flatter as the line rises, signifying deceleration. The paragraph concludes with the translation of this graph into an acceleration versus time graph, which shows a constant negative slope, indicating a constant deceleration. The speaker suggests treating complex graphs as two separate problems and then connecting them for a simpler approach.
🔄 Complex Motion Analysis: Combining Positive and Negative Slopes
The focus of this paragraph is on analyzing a complex motion graph with a straight positive slope that includes both negative and positive regions. The speaker explains how to treat this as two distinct problems, with the first part showing a negative velocity slowing down towards zero, and the second part showing a positive velocity speeding up away from zero. The translation of these motions into their respective position and acceleration graphs is detailed, emphasizing the importance of reflecting the changes in slope to accurately represent the motion. The speaker highlights the simplicity of the acceleration graph for this example, which has a constant positive slope, indicating uniform acceleration.
Mindmap
Keywords
💡motion graph
💡kinematic curves
💡accelerating
💡negative velocity
💡velocity versus time graph
💡acceleration
💡constant negative acceleration
💡position versus time graph
💡slope
💡constant positive slope
💡translation
Highlights
The video discusses translating motion graphs from one type to another, focusing on position vs. time, velocity vs. time, and acceleration vs. time graphs.
A curved position vs. time graph indicates acceleration due to its changing slope, representing a change in the rate of motion.
A straight downward motion implies negative velocity, which is reflected in the velocity vs. time graph by a line in the negative region that goes under zero.
An increasing negative velocity is shown by a line in the velocity vs. time graph that extends from zero with a straight negative slope.
The transition from a velocity vs. time graph to an acceleration vs. time graph is direct, as the slope of the velocity graph represents acceleration.
A constant negative slope in the velocity graph indicates a constant negative acceleration.
A motion with both a straight line and a slightly curved line in the position vs. time graph indicates two types of motion: constant velocity and decelerating motion.
A straight line rising in the positive direction signifies constant positive velocity, while a curving line indicates deceleration.
Deceleration is shown in the velocity vs. time graph by a negative slope moving towards zero.
The third problem starts with a velocity vs. time graph, all positive velocities indicate slowing down motion towards the positive direction.
The position vs. time graph for slowing down motion becomes flatter as the line rises, indicating a decrease in velocity.
A constant negative slope in the acceleration vs. time graph represents a constant negative acceleration, as seen in the third problem.
The fourth and most complex problem involves a velocity vs. time graph with both positive and negative slopes, indicating changes from negative to positive velocity.
The position vs. time graph for this complex motion should be treated as two separate problems and connected where the lines meet.
Despite the complexity of the motion in the fourth problem, the acceleration vs. time graph is straightforward with a constant positive slope, indicating constant positive acceleration.
The video concludes by encouraging viewers to review the content if they have questions on interpreting the graphs and to practice translating between different graph types.
Transcripts
Browse More Related Video
Position vs Time, Velocity vs Time & Acceleration vs Time Graph (Great Trick to Solve Every Graph!!)
Graphs of Motion : Easy and Quick Summary

Translating Motion Graphs: Position, Velocity, and Acceleration - IB Physics
How Do You Graph Motion? | Physics in Motion
Interpreting Motion Graphs
Kinematics Graphs
5.0 / 5 (0 votes)
Thanks for rating: