Variance - Clearly Explained (How To Calculate Variance)
TLDRThis video offers a clear explanation of variance in statistics, demonstrating how to calculate it with a sample of dog weights. It starts by defining variance as the average of squared differences from the mean, then guides viewers through the process step-by-step: finding the mean, calculating deviations, squaring them, summing, and dividing by the number of data points minus one (Bessel's correction for samples). The video also highlights the difference between sample and population variance calculations and emphasizes the use of standard deviation for easier interpretation of data spread. It concludes by encouraging viewers to like, comment, and subscribe for more educational content.
Takeaways
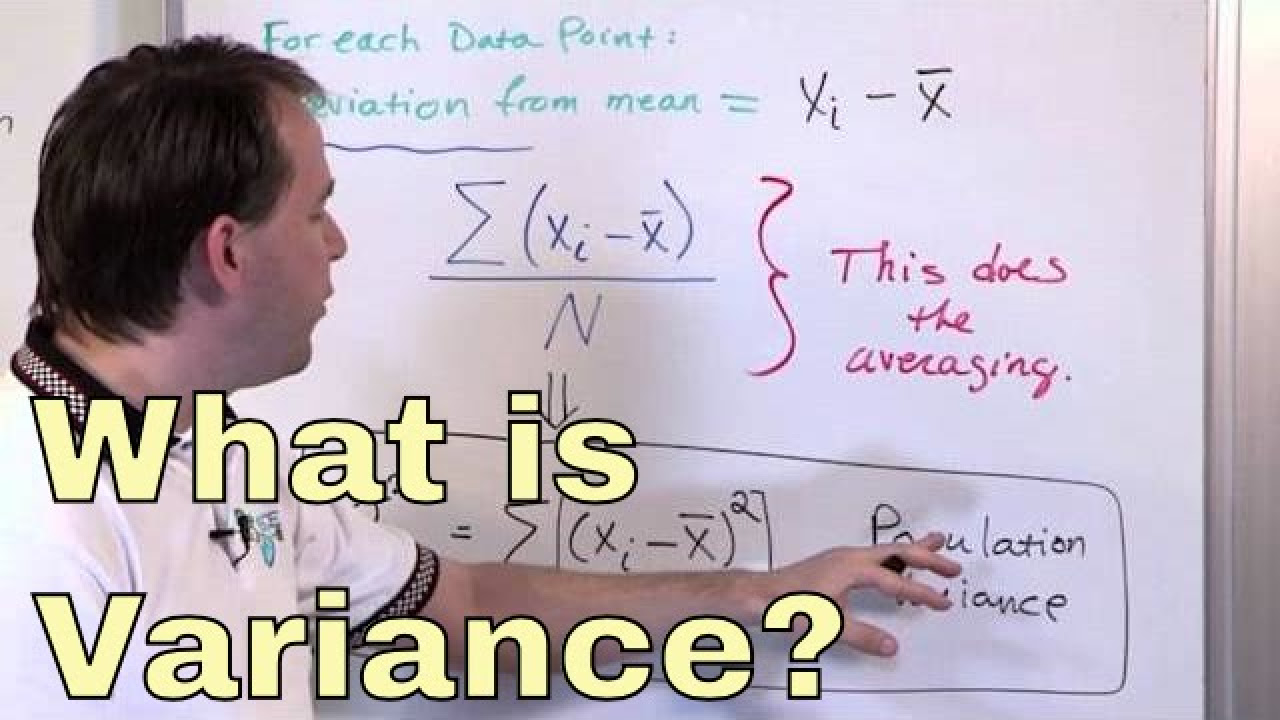
- 📚 Variance in statistics is defined as the average of the squared differences from the mean.
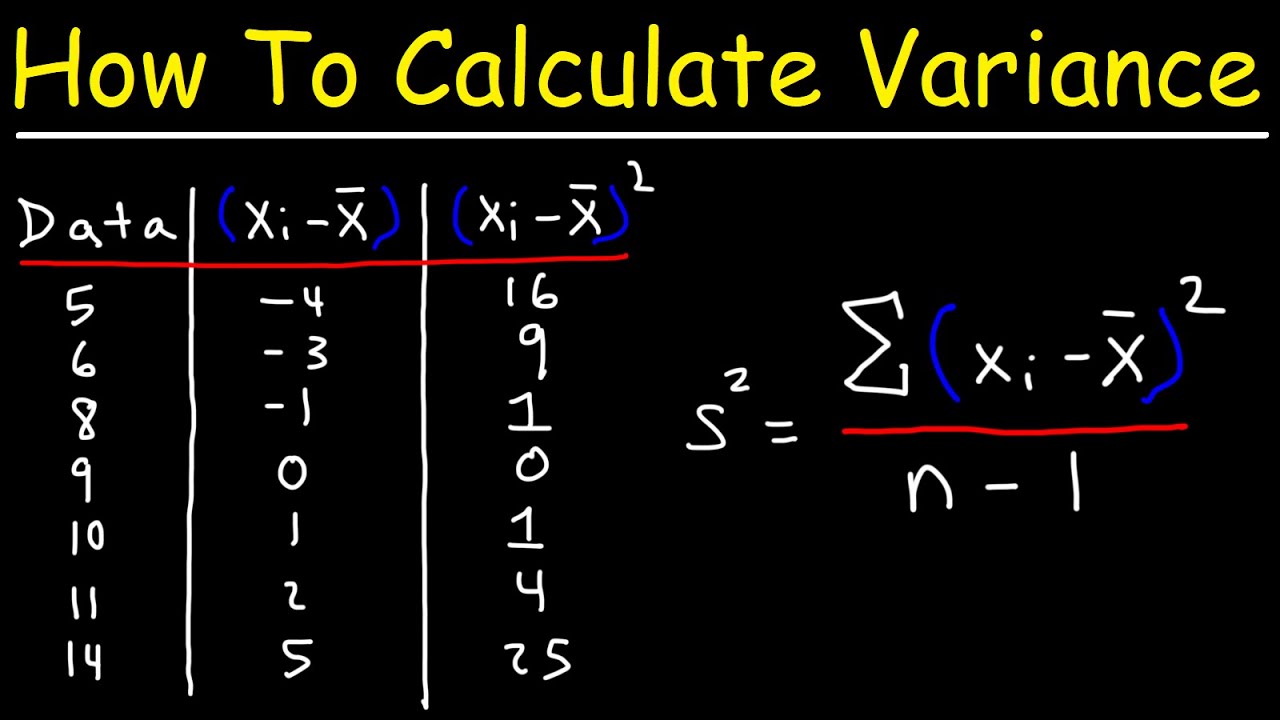
- 🐕 The video uses a sample of six dogs' weights to illustrate the calculation of variance.
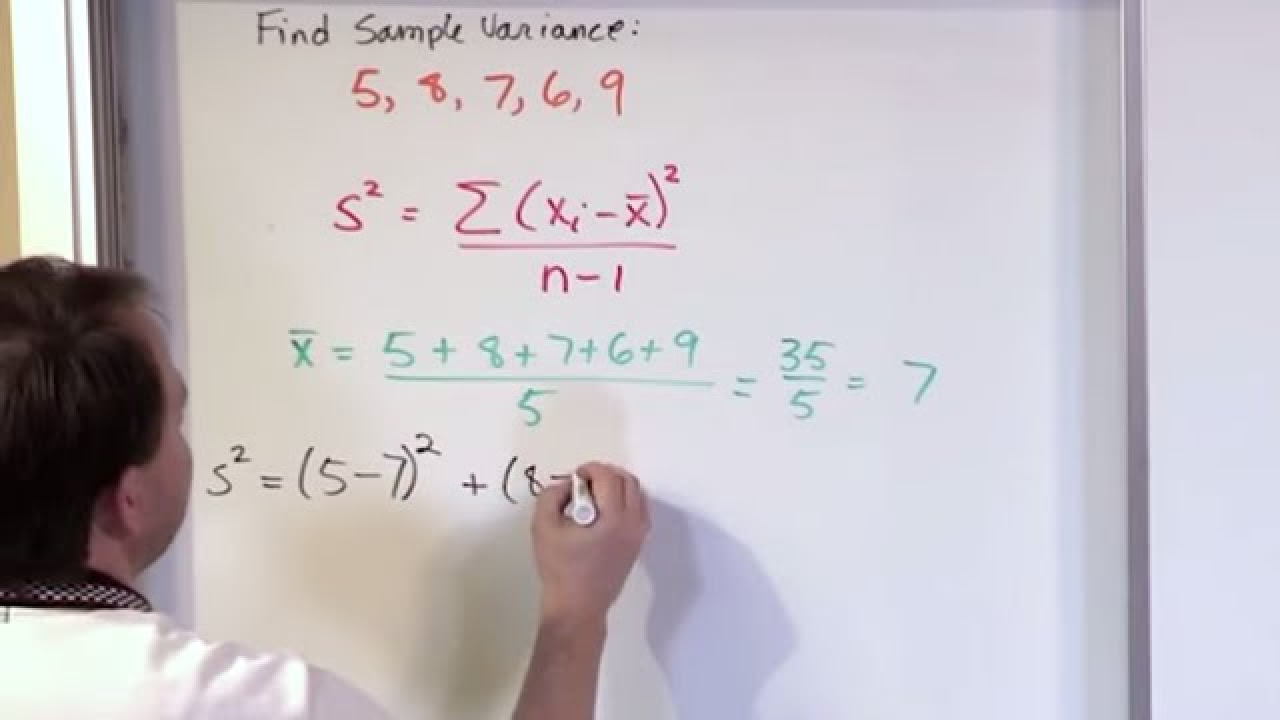
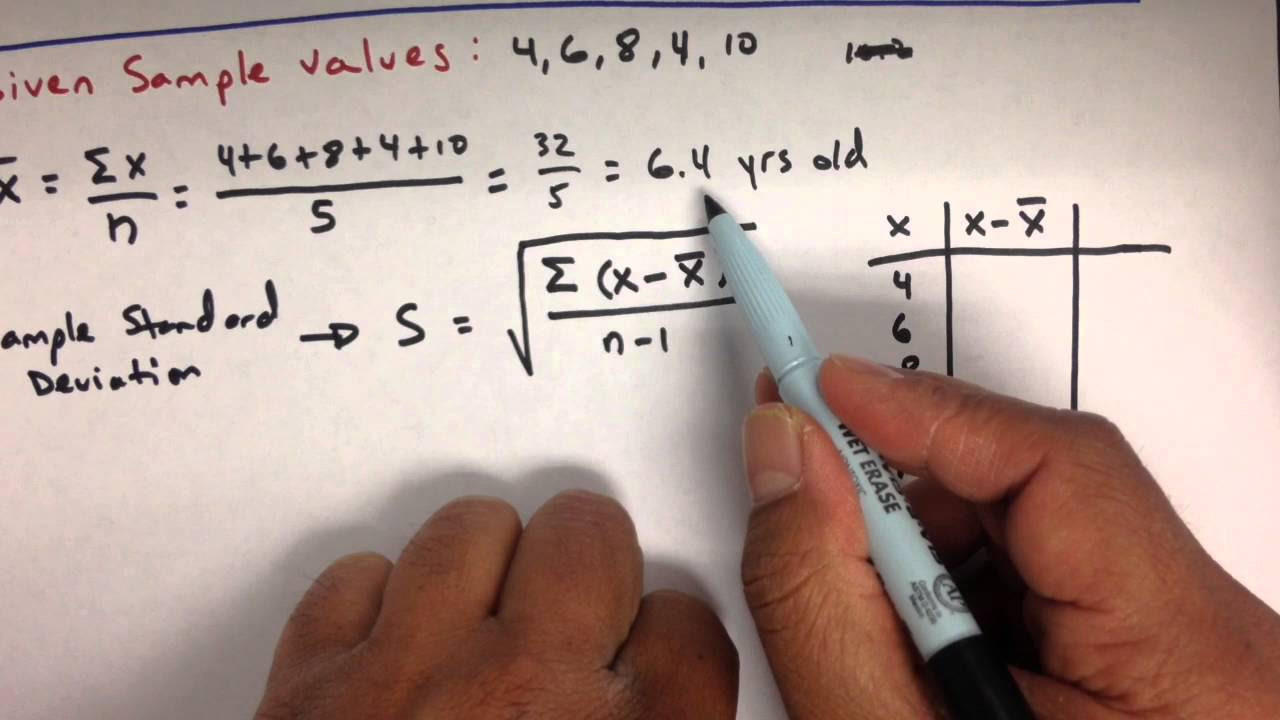
- 📉 To calculate variance, first find the mean of the data set by summing all values and dividing by the number of data points.
- 🔢 Subtract the mean from each data point to find the differences, then square each of these differences.
- ➕ Sum all the squared differences to get a total.
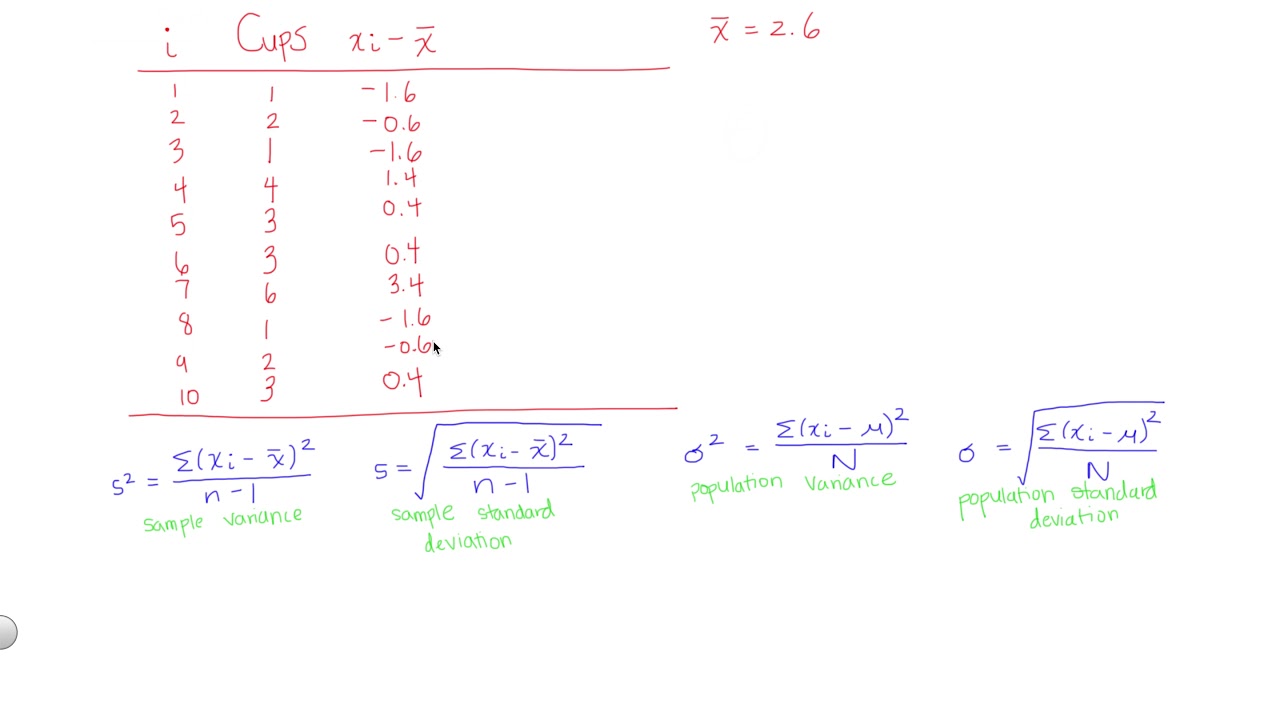
- 🔄 For a sample variance, divide the total of squared differences by the number of data points minus one (n-1).
- 📉 The units of variance are squared units, which can be challenging to interpret directly.
- 📏 Researchers often use standard deviation, which is the square root of variance, to describe data spread.
- 📊 The standard deviation is easier to interpret as it is in the same units as the original data.
- 📈 Variance and standard deviation are used to measure the spread or dispersion of data points around the mean.
- 🔍 There's a slight difference in calculating variance for a sample (n-1) versus a population (n), known as Bessel's correction.
Q & A
What is the definition of variance in statistics?
-Variance is defined as the average of the squared differences from the mean.
How is the mean value calculated in the context of the dog weights example?
-The mean value is calculated by summing all the weights and dividing by the number of dogs, which in this case is six.
Why do we subtract the mean from each data point when calculating variance?
-Subtracting the mean from each data point helps to determine how far each value deviates from the mean, which is essential for calculating variance.
Why is it necessary to square the differences from the mean in variance calculation?
-Squaring the differences ensures that all values are positive, as variance cannot be negative, and it emphasizes larger differences more than smaller ones.
What is the result of squaring the differences in terms of the units of variance?
-Squaring the differences results in the units of variance being squared as well, which can make it challenging to interpret the actual value against the original data units.
How is the variance calculated for a sample in the dog weights example?
-The variance is calculated by summing the squared differences, dividing by the number of data points minus one (Bessel's correction), and then taking the average.
What is the variance value for the dog weights example in the script?
-The variance value for the dog weights example is 28.4 kilograms squared.
Why do researchers often use standard deviation instead of variance to describe the spread of data?
-Researchers use standard deviation because it is in the same units as the original data, making it easier to interpret and plot on a graph.
How is the standard deviation calculated from the variance?
-The standard deviation is calculated by taking the square root of the variance.
What does a large standard deviation value indicate about the data?
-A large standard deviation value indicates high variability from the mean, meaning the data points are more spread out.
What is Bessel's correction and why is it used when calculating the variance of a sample?
-Bessel's correction is the practice of dividing by the number of data points minus one (n-1) instead of n when calculating the variance of a sample. It corrects for bias that can occur in estimating the population variance from a sample.
What is the difference in calculating variance for a sample versus a population?
-The main difference is in the denominator: for a sample, you divide by n-1 (number of data points minus one), while for a population, you divide by n (the total number of data points).
Outlines
📊 Understanding Variance in Statistics
This paragraph introduces the concept of variance in statistics and explains it as the average of squared differences from the mean. The speaker provides a step-by-step example using the weights of six dogs to illustrate how variance is calculated. Starting with finding the mean weight, the process involves subtracting the mean from each data point, squaring the results, summing these squared differences, and finally dividing by the number of data points minus one (for a sample). The example concludes with a variance value of 28.4 kilograms squared, which the speaker notes is difficult to interpret due to its squared units. The paragraph also mentions that researchers often use standard deviation, the square root of variance, for ease of interpretation and comparison with the original data units.
🔍 Calculating Variance for Samples and Populations
The second paragraph delves into the subtle differences between calculating variance for a sample and for an entire population. It emphasizes that the process remains largely the same, with the key distinction being the denominator used in the final division step: n-1 for samples and n for populations. This difference is attributed to Bessel's correction, which adjusts for bias when estimating the population variance from a sample. The speaker reminds viewers of the importance of this distinction and concludes the video by encouraging engagement through likes, comments, and subscriptions for more educational content.
Mindmap
Keywords
💡Variance
💡Mean
💡Sample
💡Population
💡Standard Deviation
💡Squared Differences
💡Bessel's Correction
💡Data Points
💡Spread
💡Graph
Highlights
Variance in statistics is defined as the average of the squared differences from the mean.
A practical example is given using the weights of six dogs to illustrate the calculation of variance.
Mean value is calculated by summing all values and dividing by the number of data points.
Each data point's deviation from the mean is determined and squared to prepare for variance calculation.
Squaring values ensures that all variance values are positive, as negative values are not possible.
The sum of squared deviations is calculated before dividing by the number of data points.
For a sample, variance is calculated by dividing the sum of squared deviations by the number of data points minus one.
The variance value represents the average squared differences from the mean.
The units of variance are squared, which can make it challenging to interpret against the original data units.
Standard deviation is often used instead of variance, as it is the square root of variance and has the same units as the data.
The standard deviation is calculated by taking the square root of the variance value.
A large standard deviation indicates high variability from the mean, while a smaller one indicates less variability.
The standard deviation can be plotted on a graph to visually represent the spread of data.
There is a slight difference in calculating variance for a sample versus a population, mainly in the denominator.
Bessel's correction (n-1) is used when calculating the variance of a sample to correct for bias.
The video concludes with a summary of variance calculation for both a sample and a population.
The video encourages viewers to like, comment, and subscribe for more weekly tutorials.
Transcripts
Browse More Related Video
Lesson 15 - Calculating Variance in Statistics
Variance and Standard Deviation: Sample and Population Practice Statistics Problems
What is Variance in Statistics? Learn the Variance Formula and Calculating Statistical Variance!
How to Calculate Standard Deviation and Variance by Hand
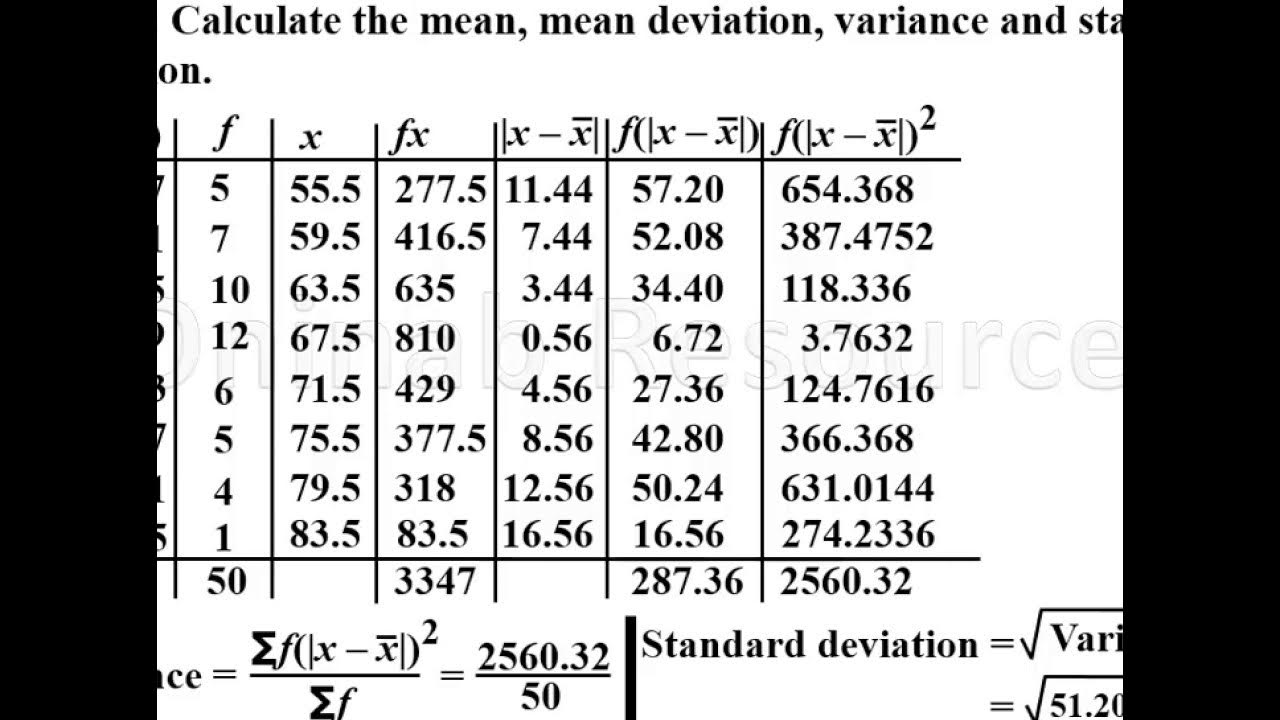
Mean deviation, variance and standard deviation of grouped data.
How To Calculate Variance
5.0 / 5 (0 votes)
Thanks for rating: