Variance, Standard Deviation, Coefficient of Variation
TLDRThis video script delves into the core concepts of quantifying variability in statistics, focusing on variance, standard deviation, and the coefficient of variation. It explains the distinction between population and sample data, emphasizing the unique formulas used for each. The script provides a clear example of calculating variance and standard deviation for a set of numbers, illustrating why sample variance is often higher. It also introduces the coefficient of variation as a tool for comparing variability across different datasets, demonstrating its utility with a practical example involving pizza prices in New York. The summary underscores the importance of these measures in understanding and comparing data sets effectively.
Takeaways
- 📚 Variance, standard deviation, and coefficient of variation are the three main measures discussed for quantifying variability in statistics.
- 🔍 Different formulas are used for population data and sample data to account for the difference in certainty and potential variability.
- 📉 Variance measures the dispersion of data points around their mean value, with population variance calculated as the sum of squared differences from the mean, divided by the number of observations.
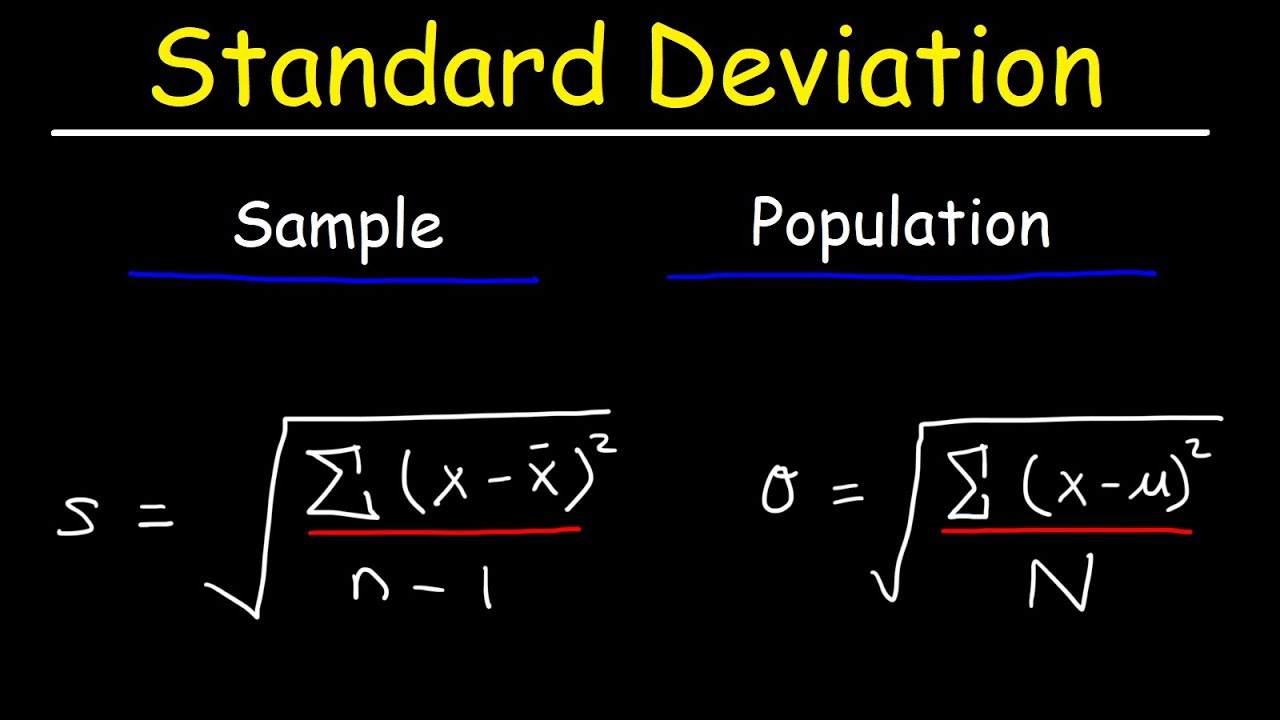
- 📈 Sample variance is calculated similarly but uses the number of sample observations minus one in the denominator, reflecting the uncertainty inherent in sampling.
- 🧩 Squaring the differences in the variance formula serves to ensure non-negative results and to amplify the effect of large differences, which is crucial for understanding dispersion.
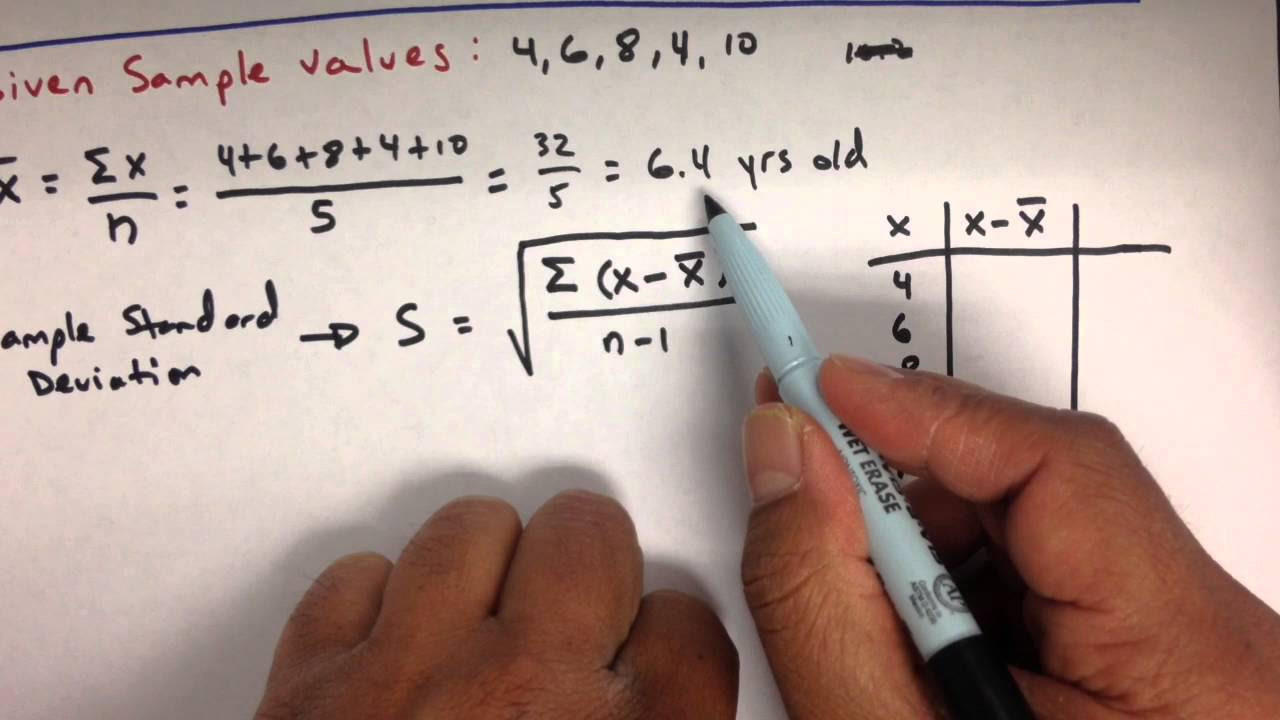
- 🌰 An example is provided to illustrate the calculation of variance for a population and a sample, highlighting the difference in results and interpretation.
- 📊 Standard deviation is the square root of variance and is more interpretable than variance because it is in the original units of measurement.
- 🔢 The coefficient of variation (relative standard deviation) is calculated as the standard deviation divided by the mean, providing a way to compare variability across different data sets.
- 🎯 The coefficient of variation is particularly useful for comparing the relative variability of different data sets, as it normalizes the standard deviation by the mean.
- 🍕 An example using pizza prices in dollars and Mexican pesos demonstrates the calculation of standard deviation and coefficient of variation, and how the latter allows for meaningful comparison between data sets.
- 📝 The script emphasizes the importance of understanding and being able to use these measures of variability for more complex statistical analysis.
Q & A
What are the three common measures of variability discussed in the script?
-The three common measures of variability discussed in the script are variance, standard deviation, and coefficient of variation.
Why do we use different formulas for population data and sample data in statistics?
-Different formulas are used for population data and sample data because when you have the whole population, each data point is known, giving you 100% certainty of the measures you calculate. However, when you take a sample, the calculated statistic is an approximation of the population parameter, and different samples will yield different measures.
What is the formula for calculating population variance?
-Population variance, denoted by sigma squared, is calculated as the sum of squared differences between the observed values and the population mean, divided by the total number of observations.
How is sample variance different from population variance in terms of its formula?
-Sample variance, denoted by s squared, is calculated similarly to population variance but is divided by the number of sample observations minus 1, instead of the total number of observations.
Why do we square the differences between observed values and the mean when calculating variance?
-Squaring the differences serves two main purposes: it ensures non-negative computations since dispersion cannot be negative, and it amplifies the effect of large differences, making the measure more sensitive to outliers.
Can you provide an example of calculating population variance from the script?
-Sure, the example given in the script is a population of five observations – 1, 2, 3, 4, and 5. The mean is 3. The variance is calculated as (1-3)^2 + (2-3)^2 + (3-3)^2 + (4-3)^2 + (5-3)^2, all divided by 5, which equals 2.
What is the reason behind having a larger sample variance compared to population variance?
-The sample variance is larger than the population variance because it reflects the higher potential variability that might exist in the entire population from which the sample was drawn.
How is standard deviation related to variance?
-Standard deviation is the square root of variance. It is used because it provides a measure of dispersion in the original units of the data, making it more interpretable than variance, which is in squared units.
What is the coefficient of variation and why is it useful?
-The coefficient of variation is the standard deviation divided by the mean, also known as the relative standard deviation. It is useful for comparing the variability of different data sets on a relative scale, as it is unit-free.
Can you explain the example given in the script about comparing standard deviations and coefficients of variation?
-The script provides an example of comparing pizza prices in dollars and Mexican pesos. While the standard deviations in dollars and pesos (3.27 and 61.59 respectively) seem different, the coefficients of variation (0.60 in both cases) show that the variability in the two data sets is the same.
Why is the coefficient of variation a better measure for comparing variability between different data sets?
-The coefficient of variation is a better measure for comparing variability between different data sets because it is a dimensionless measure (not dependent on the units of the data), allowing for a fair comparison of relative variability.
Outlines
📊 Understanding Variability Measures in Statistics
This paragraph introduces the fundamental concepts of quantifying variability in statistics, focusing on variance, standard deviation, and coefficient of variation. It explains the distinction between population data and sample data, emphasizing the use of different formulas for each. Variance is defined as the dispersion of data points around the mean, with formulas provided for both population variance (sigma squared) and sample variance (s squared). The explanation includes a practical example using a set of five observations to illustrate the calculation of variance. The paragraph concludes by highlighting why sample variance is typically higher than population variance, using an extended population example to clarify this concept.
📈 Exploring the Practicality of Standard Deviation and Coefficient of Variation
The second paragraph delves into the practical applications of standard deviation and coefficient of variation as measures of data dispersion. It clarifies that while variance is a common measure, it is often challenging to interpret due to its squared unit of measurement. The solution is presented as calculating the square root of variance to obtain standard deviation, which is more meaningful and directly interpretable. The paragraph also introduces the coefficient of variation, which is the standard deviation divided by the mean, and is useful for comparing variability across different datasets. An example is provided comparing pizza prices in dollars and Mexican pesos, demonstrating how standard deviations can be misleading across different units but coefficients of variation provide a meaningful comparison. The summary concludes with a recap of the three main measures of variability and their applications, encouraging viewers to feel confident in using these statistical tools.
Mindmap
Keywords
💡Variability
💡Variance
💡Standard Deviation
💡Coefficient of Variation
💡Population Data
💡Sample Data
💡Mean
💡Median
💡Mode
💡Dispersion
💡Sample Variance
Highlights
Introduction to common measures of variability: variance, standard deviation, and coefficient of variation.
Explanation of the difference between population data and sample data in statistics.
Unique formulas for mean, median, and mode for population and sample data.
Variance measures the dispersion of data points around their mean value.
Population variance formula using sigma squared.
Sample variance formula using s squared and its adjustment for sample size.
Importance of squaring differences in variance calculation for non-negative results.
Practical example of calculating population variance with a set of five observations.
Difference between population variance and sample variance explained through an example.
Standard deviation as the square root of variance for easier interpretation.
Coefficient of variation as a measure to compare variability across different data sets.
Example of comparing standard deviations and coefficients of variation for pizza prices in dollars and pesos.
Demonstration of how coefficients of variation allow for meaningful comparison between data sets.
Recap of the three main measures of variability and their applications.
Emphasis on the practicality of standard deviation and coefficient of variation in statistics.
Encouragement for viewers to feel confident in using these measures for more complex statistical topics.
Transcripts
Browse More Related Video

Standard Deviation and Coefficient of Variation
Variance and Standard Deviation: Sample and Population Practice Statistics Problems

Statistics: Standard deviation | Descriptive statistics | Probability and Statistics | Khan Academy
Measures of Dispersion (Ungrouped Data) | Basic Statistics
Standard Deviation Formula, Statistics, Variance, Sample and Population Mean

Measures of Variability (Range, Standard Deviation, Variance)
5.0 / 5 (0 votes)
Thanks for rating: