Midpoint sums | Accumulation and Riemann sums | AP Calculus AB | Khan Academy
TLDRThe video script introduces the concept of approximating the area under a curve using rectangles. It illustrates this with the curve y = x^2 + 1 from x = -1 to x = 2. The method of breaking the interval into equal sections and using the midpoint, left endpoint, or right endpoint to determine the height of the rectangles is discussed. The script emphasizes that more rectangles lead to better approximations, highlighting the importance of the number of rectangles and their width in refining the estimate of the true area.
Takeaways
- 📈 The video explains the concept of approximating the area under a curve using rectangles.
- 🌟 The specific curve used as an example is y = x^2 + 1, from x = -1 to x = 2.
- 🔍 The interval from -1 to 2 is divided into three equal sections for the approximation.
- 📏 The width of each section is one, and the height is determined by the function's value at the midpoint.
- 🏢 The first rectangle's height is calculated as (-1/2)^2 + 1, resulting in an area of 5/4.
- 🏢 The second rectangle also has an area of 5/4, with the height calculated similarly.
- 🏢 The third rectangle's height is calculated as (3/2)^2 + 1, giving an area of 13/4.
- 🔄 This method of approximation is known as the midpoint approximation.
- 🔄 Alternative methods include using the left or right endpoints to define the height of the rectangles.
- 📈 Using left endpoints yields an approximation of 5 (2 + 1 + 2), while using right endpoints yields 8 (1 + 2 + 5).
- 🚀 Adding more rectangles with thinner widths covering the interval would improve the accuracy of the approximation.
Q & A
What is the main topic of the video?
-The main topic of the video is understanding how to approximate the area under a curve using rectangles.
Which specific curve is used as an example in the video?
-The curve y equals x squared plus one is used as an example in the video.
What is the interval范围 over which the area under the curve is being approximated?
-The area under the curve is being approximated from x equals negative one to x equals two.
How many equal sections or rectangles does the instructor initially use to approximate the area?
-The instructor initially uses three equal sections or rectangles to approximate the area.
How are the heights of the rectangles determined in the midpoint approximation method?
-In the midpoint approximation method, the heights of the rectangles are determined by the value of the function at the midpoint of each interval.
What are the midpoints and their corresponding heights for each of the three intervals in the example?
-The midpoints are negative 1/2, 1/2, and 3/2, and their corresponding heights are 5/4, 5/4, and 13/4 respectively.
What is the total approximate area under the curve using the midpoint approximation method?
-The total approximate area under the curve using the midpoint approximation method is 23/4 or 5 3/4.
What are the alternative methods mentioned for defining the heights of the rectangles?
-The alternative methods mentioned for defining the heights of the rectangles are using the left endpoint and the right endpoint of each interval.
What are the total approximate areas using the left endpoint and right endpoint approximation methods?
-Using the left endpoint approximation method, the total area is 5. Using the right endpoint approximation method, the total area is 8.
How does increasing the number of rectangles affect the accuracy of the approximation?
-Increasing the number of rectangles with thinner bases while still covering the interval from x equals negative one to x equals two will yield better and more accurate approximations of the true area under the curve.
What can be inferred about the accuracy of approximations based on the comparison between the midpoint, left endpoint, and right endpoint methods?
-The comparison suggests that the midpoint approximation tends to provide a more accurate estimate than simply using the left or right endpoints, which can result in under or over counting the area.
Outlines
📊 Approximating Area Under a Curve
This paragraph introduces the concept of approximating the area under a curve, specifically using the curve y = x^2 + 1 from x = -1 to x = 2. The instructor explains the method of breaking the interval into three equal sections and using rectangles as a means of approximation. The strategy involves defining the height of each rectangle by the function's value at the midpoint of each section. The midpoints are calculated (-1/2, 1/2, and 3/2), and the corresponding heights are determined by squaring these values and adding one. The areas of the rectangles are then computed by multiplying the heights by the width of each section (1 unit). This method of approximation is referred to as the midpoint approximation.
📈 Comparing Different Approximation Methods
The second paragraph discusses the comparison of approximation methods by evaluating the area under the curve using left and right endpoints, in addition to the midpoint method previously explained. The left endpoint approximation yields a total area of 5 (2 + 1 + 2), while the right endpoint approximation results in an area of 8 (1 + 2 + 5). This comparison illustrates that using endpoints can lead to over or under counting of the actual area. The paragraph emphasizes the idea that increasing the number of rectangles with narrower bases will improve the accuracy of the approximations. The goal is to understand how different methods can affect the computation of the area and to appreciate the process of approximation through rectangles.
Mindmap
Keywords
💡Approximation
💡Curve
💡Area
💡Interval
💡Rectangles
💡Midpoint
💡Function
💡Endpoints
💡Left Endpoint
💡Right Endpoint
💡Overapproximation
Highlights
The video aims to understand how to approximate the area under a curve, specifically using the curve y = x^2 + 1.
The area of interest is above the x-axis, from x = -1 to x = 2.
The method used for approximation involves breaking the interval into equal sections and using rectangles as a base.
The height of each rectangle is defined by the function's value at the midpoint of each interval section.
The first rectangle's height is calculated by taking the square of -1/2 and adding 1, resulting in a height of 5/4.
The second rectangle also has a height of 5/4, using the same method of calculating the square of the midpoint (1/2) and adding 1.
The third rectangle's height is determined by squaring 3/2 and adding 1, giving a height of 13/4.
The total area approximation using midpoints results in 23/4 or 5 3/4.
An alternative method of approximation is introduced, which involves using the left endpoints of the intervals.
Using left endpoints, the total area is calculated as 2 + 1 + 2, summing up to 5.
Another alternative is using the right endpoints, which results in an overestimation of the area.
The right endpoint method gives a total area of 1 + 2 + 5, equaling 8.
The concept of increasing the number of rectangles to get a better approximation is discussed.
The video emphasizes the importance of understanding different methods for approximating areas under curves.
The midpoint approximation method is explained in detail, providing a clear step-by-step process.
The video serves as an educational resource for those looking to understand mathematical approximation techniques.
Transcripts
Browse More Related Video

Riemann approximation introduction | Accumulation and Riemann sums | AP Calculus AB | Khan Academy

Riemann sums in summation notation | Accumulation and Riemann sums | AP Calculus AB | Khan Academy
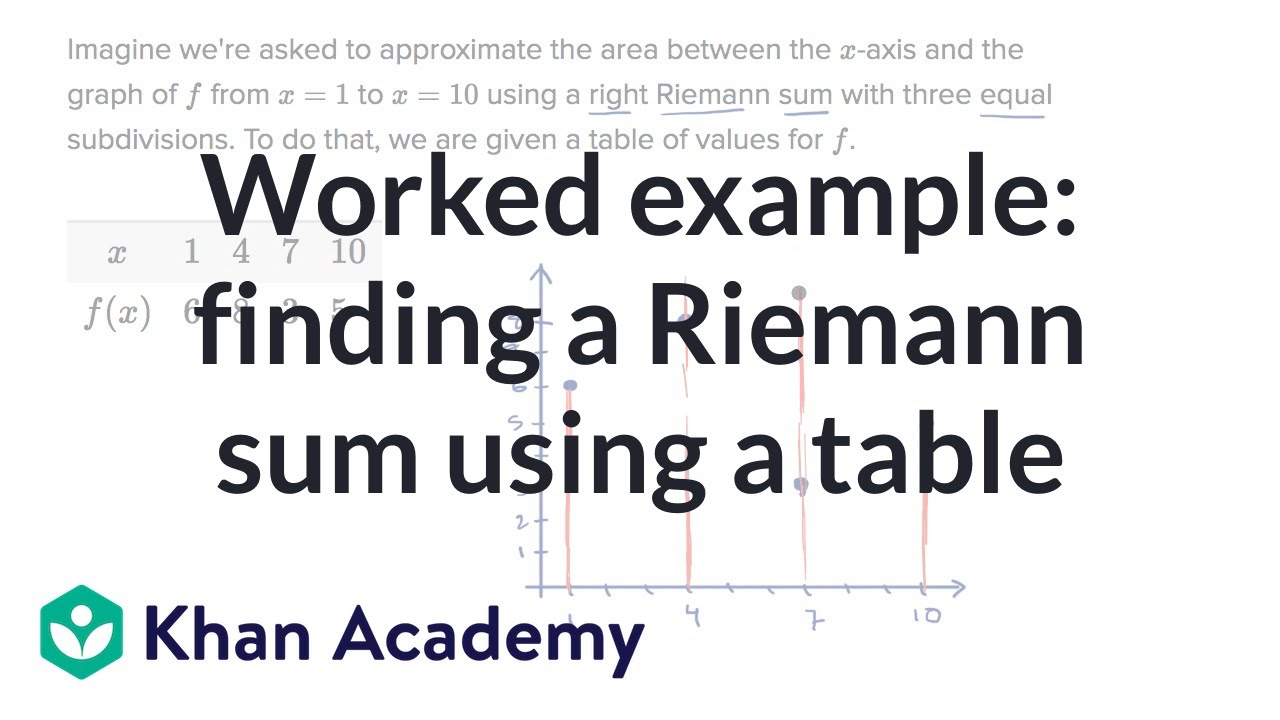
Worked example: finding a Riemann sum using a table | AP Calculus AB | Khan Academy
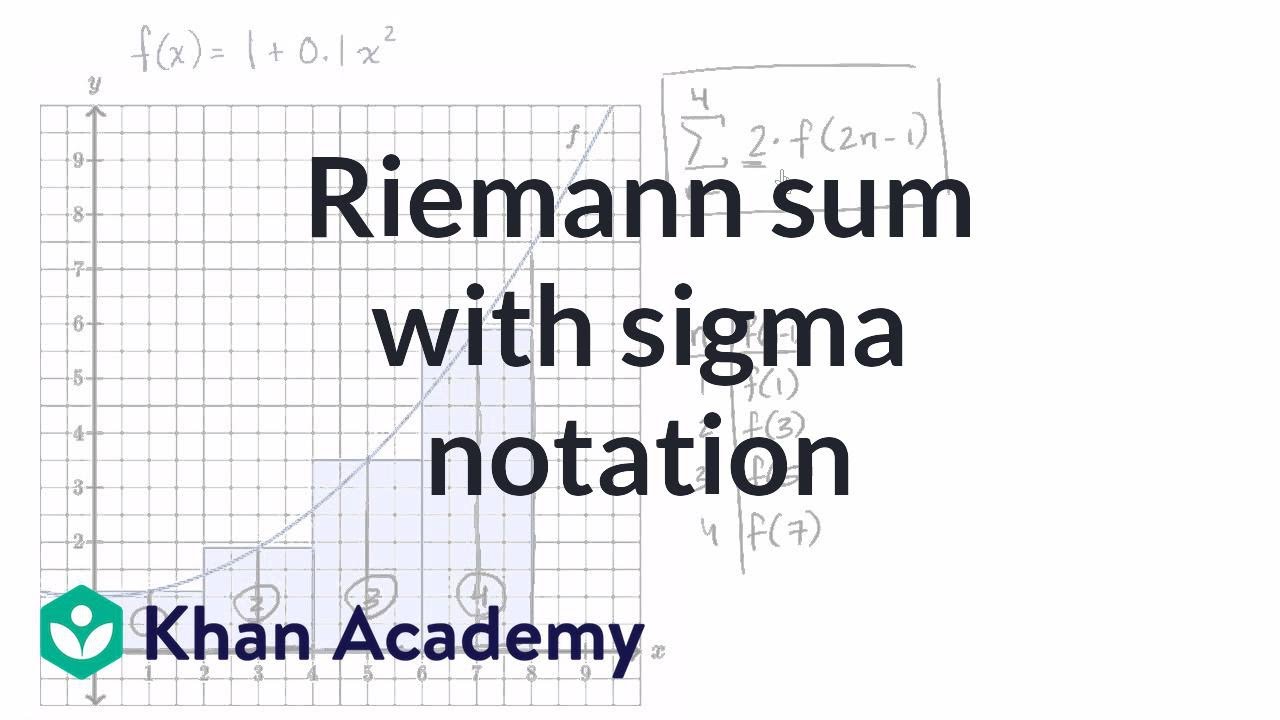
Worked example: Riemann sums in summation notation | AP Calculus AB | Khan Academy
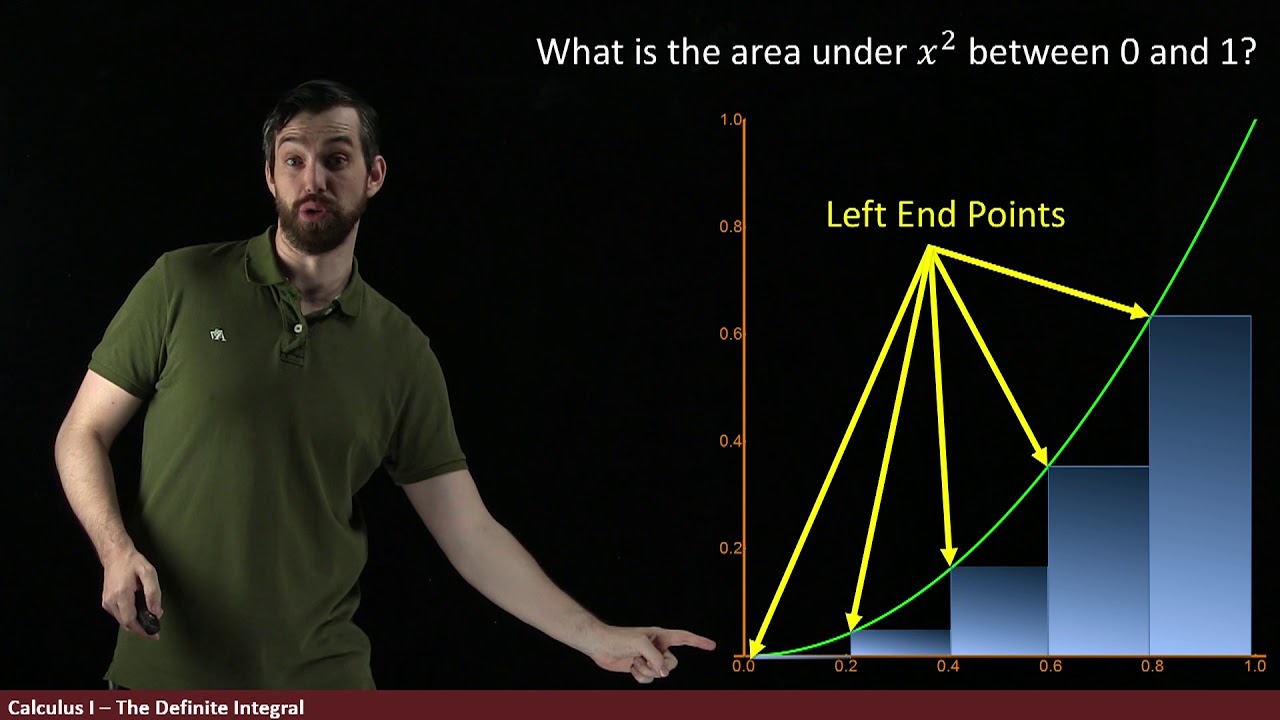
The Definite Integral Part I: Approximating Areas with rectangles

The Definite Integral Part III: Evaluating From The Definition
5.0 / 5 (0 votes)
Thanks for rating: