The Definite Integral Part I: Approximating Areas with rectangles
TLDRThe video script introduces the concept of the integral as a fundamental tool in calculus, following a period of focusing on differentiation. The integral is illustrated through a geometric question about finding the area under the curve of y = x^2 between 0 and 1, which is not a simple shape with an existing formula. To approximate this area, the video uses rectangles that align with the curve at their right endpoints, creating a series of rectangles with varying heights based on the curve's value at those points. The approximation improves as the number of rectangles increases, leading to the idea of using an infinite number of rectangles to find the true area under the curve. This process is the essence of the integral, which is defined as the limit of the sum of these rectangles as the number of rectangles approaches infinity, providing a method to calculate areas under curves that are not easily defined by traditional geometric shapes.
Takeaways
- 📈 The integral is the second major tool in calculus, which is introduced after differentiation.
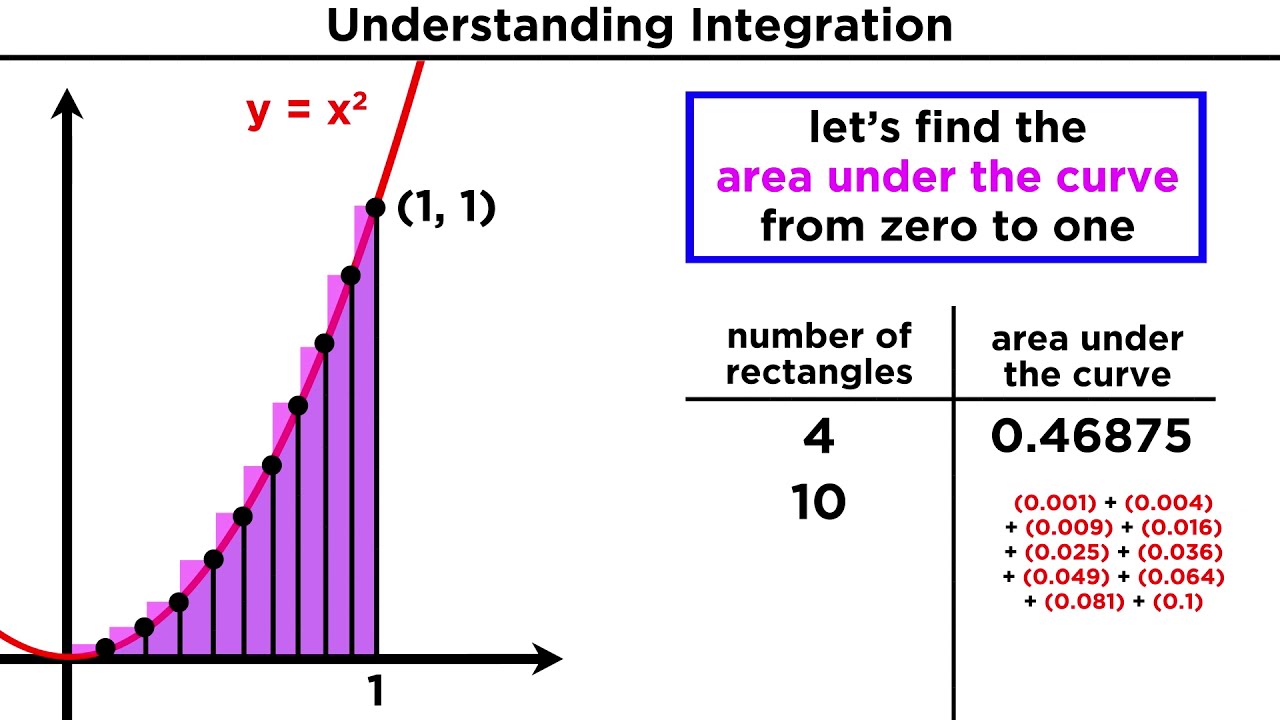
- 📐 The integral is used to find areas under curves, like the graph of y = x^2 between 0 and 1, which cannot be calculated with simple geometric shapes.
- 🟩 The concept of an interval is introduced as a partition of the x-axis to help approximate the area under a curve.
- 🟫 Rectangular approximations are used to estimate the area under a curve by dividing it into smaller regions and summing the areas of rectangles.
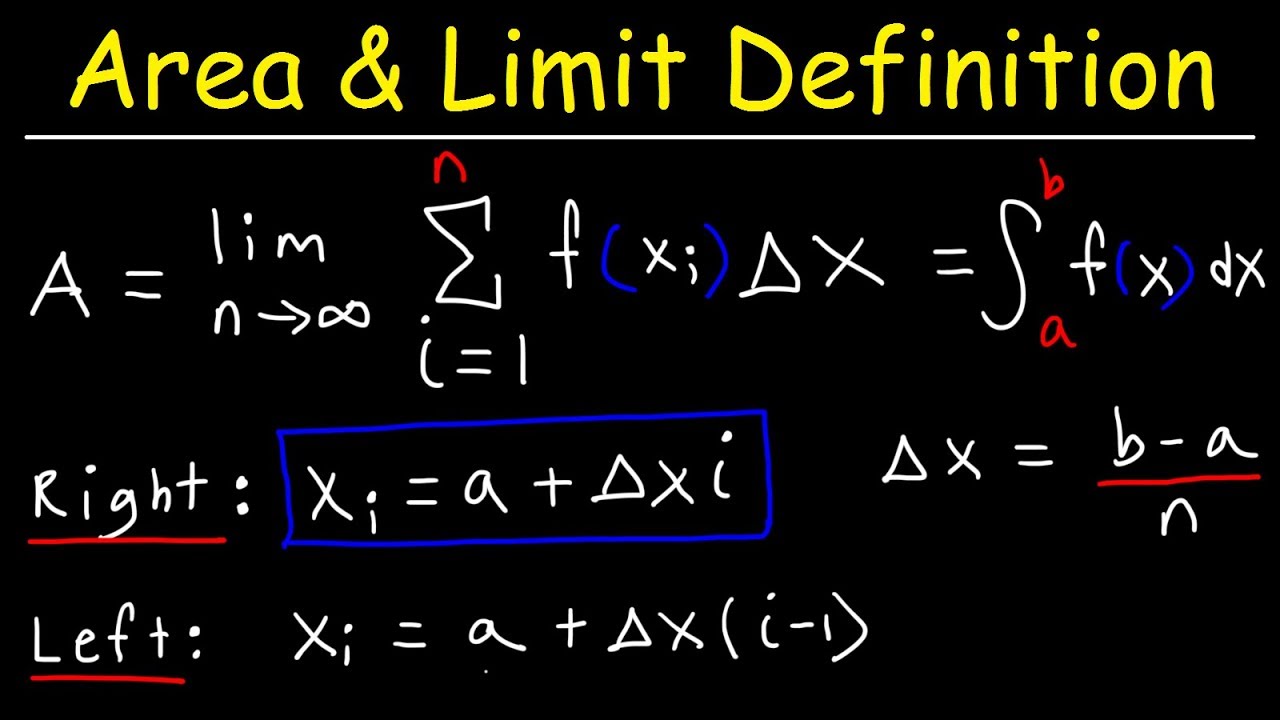
- 🔺 Using right endpoints to define the height of the rectangles results in an overestimation of the area under the curve.
- 🔻 Using left endpoints to define the height of the rectangles results in an underestimation of the area under the curve.
- 🔲 The number of rectangles used in the approximation affects the accuracy; more rectangles lead to a finer approximation and smaller error.
- 🔃 The process of increasing the number of rectangles is a way to refine the approximation, with the idea that as the number of rectangles approaches infinity, the approximation becomes more accurate.
- 🛑 The true area under the curve is equal to the limit of the sum of the areas of the rectangles as the number of rectangles (n) approaches infinity.
- 📊 The integral is defined as the limit of the sum of the areas of rectangles (or other shapes) as the number of intervals (n) increases without bound.
- 🔢 The integral can answer various questions, including but not limited to finding areas under curves, which is a foundational application.
Q & A
What is the main topic of the video?
-The main topic of the video is the introduction of the integral as the second major tool in calculus, with a focus on using it to find areas under curves that do not correspond to simple geometric shapes.
What is the interval in the context of the video?
-The interval refers to the division of the x-axis (in this case, between 0 and 1) into smaller segments to approximate the area under the curve using rectangles.
How does the video use rectangles to approximate the area under the curve?
-The video uses rectangles with a constant width and varying heights that align with the curve at their right endpoints to approximate the area under the curve y = x^2 between 0 and 1.
What is the significance of increasing the number of rectangles used in the approximation?
-Increasing the number of rectangles used in the approximation improves the accuracy of the area calculation. As more rectangles are used, the gaps between the rectangles and the curve decrease, leading to a better approximation of the actual area.
What is the concept of using left endpoints to approximate the area under the curve?
-Using left endpoints involves positioning rectangles so that their left endpoints align with the curve, which can result in a different approximation of the area compared to using right endpoints.
How does the integral help in defining the area under a curve?
-The integral defines the area under a curve by taking the limit of the sum of the areas of rectangles (or other shapes) as the number of these shapes approaches infinity, effectively 'filling in' the gaps between the shapes and the curve.
What is the purpose of using different methods to approximate the area, such as right endpoints and left endpoints?
-Using different methods provides a way to compare approximations and understand the error in each method. It also demonstrates how the integral can be approached from different perspectives to arrive at a more accurate understanding of the area under a curve.
What does the video imply about the relationship between the number of rectangles and the error in the approximation?
-The video implies that a larger number of rectangles results in a smaller error in the approximation. As the number of rectangles increases, the approximation becomes more accurate because the rectangles better fit the curve's shape.
How does the integral help answer foundational questions in calculus?
-The integral helps answer foundational questions in calculus by providing a method to calculate areas, volumes, and other quantities that are not easily defined by simple geometric formulas, especially for shapes that are irregular or complex.
What is the geometric interpretation of the integral in the context of the video?
-The geometric interpretation of the integral in the video is as a limit process that refines the approximation of the area under a curve by summing the areas of an infinite number of rectangles that fit under the curve.
Why is the integral considered a major tool in calculus?
-The integral is considered a major tool in calculus because it allows for the calculation of quantities that are not directly accessible through algebraic methods, such as the area under a curve, volumes of revolution, and rates of change that are not constant.
How does the video demonstrate the concept of limits in calculus?
-The video demonstrates the concept of limits by showing how the approximation of the area under a curve improves as the number of rectangles used in the approximation increases, ultimately approaching the true area as the number of rectangles goes to infinity.
Outlines
📐 Introduction to Calculus: The Integral
The speaker expresses excitement about moving beyond differentiation to explore the integral, a second major tool in calculus. They introduce the concept by posing a geometric question about finding the area under the curve of y = x^2 between 0 and 1. This area is not a standard shape, so traditional formulas don't apply. To approximate the area, the speaker uses rectangles that align with the curve at their right endpoints, creating a series of overlapping rectangles. The width of each rectangle is constant (0.2 units), while the height varies based on the curve's value at the right endpoint. This method overestimates the area but provides a crude approximation. The speaker then demonstrates an alternative using left endpoints for the rectangles, which underestimates the area. The key takeaway is that increasing the number of rectangles (n) used in the approximation reduces the error, leading to a better estimate of the true area under the curve.
🔍 The Limit of Rectangles: Approaching the True Area
Building on the previous approximation method, the speaker discusses the concept of increasing the number of rectangles (n) to refine the approximation. They suggest that if n were to increase to fifty, a hundred, or even a hundred million, the approximation would become increasingly accurate. The speaker then introduces the idea of taking the limit as n approaches infinity, which is the fundamental concept behind the integral. This process involves shrinking the gaps between the rectangles to the point where they effectively become a continuous approximation of the area under the curve. The true area is then defined as the limit of the sum of the areas of the rectangles as n approaches infinity, symbolizing a precise method to find the area under any curve, regardless of its shape.
Mindmap
Keywords
💡Differentiation
💡Integral
💡Interval
💡Geometric question
💡Curve
💡Approximation
💡Rectangles
💡Right endpoint
💡Left endpoint
💡Numerical computation
💡Limit
💡Area under the curve
Highlights
Introduction to the second major tool in calculus: the integral.
Exploring the concept of the interval and its usefulness in calculus.
Geometric question posed: finding the area under the curve of y = x^2 between 0 and 1.
Using rectangles to approximate the area under a curve as a method to define the integral.
Division of the curve into 5 regions to provide a crude approximation of the area.
Each rectangle has a fixed width of 0.2 and a height determined by the curve.
The area of the rectangles is computed to provide an overestimate of the actual area under the curve.
Numerical computation of the area results in an approximation of 0.44.
Comparison of the approximation to the area of a triangle from 0 to 1, which is 1/2.
Introduction of left endpoint rectangles as an alternative method for area approximation.
Left endpoint rectangles result in an underestimate of the area, with a computed value of 0.24.
Discussion on the trade-off between the number of rectangles and the accuracy of the approximation.
Increasing the number of rectangles from 5 to 10 improves the approximation.
The concept that increasing the number of rectangles (n) leads to a better approximation of the true area.
The idea of letting n approach infinity to find the exact area under the curve.
The integral is defined as the limit of the sum of rectangles as the number of rectangles (n) approaches infinity.
The integral provides a way to find the area under any curve, not just those with simple geometric shapes.
Transcripts

5.0 / 5 (0 votes)
Thanks for rating: