Worked example: Riemann sums in summation notation | AP Calculus AB | Khan Academy
TLDRThis video script focuses on approximating the area under a curve using the concept of sigma notation. The curve in question is f(x) = 1 + 0.1x^2, and the area is approximated between x=0 and x=8 using four rectangles. Each rectangle's height corresponds to the function's value at the midpoint of the interval, and their widths are equal, determined by the interval's division. The script guides the viewer through the process of expressing this area approximation in sigma notation, which involves the function value at points 1, 3, 5, and 7. The final calculation results in an approximation of 24.8 for the area under the curve.
Takeaways
- 📈 The video focuses on approximating the area under curves using rectangles and understanding sigma notation.
- 📊 The graph displayed is f(x) = 1 + 0.1x^2, and the area under this curve from x=0 to x=8 is to be approximated.
- 🔍 The curve is divided into four equal rectangles, each with a width of 2 units, based on the intervals [0,2], [2,4], [4,6], and [6,8].
- 📐 The height of each rectangle is determined by the function's value at the midpoint of the interval, i.e., f(1), f(3), f(5), and f(7).
- 🤔 The sigma notation is introduced to represent the sum of the areas of the rectangles as an approximation of the area under the curve.
- 📝 The sigma notation is expressed as ∑ (from n=1 to 4) of 2*f(2n-1), representing the sum of the areas of the individual rectangles.
- 🧮 The video encourages viewers to pause and attempt the sigma notation on their own before revealing the solution.
- 👀 The relationship between the sigma notation and the rectangle's height is clarified by showing that the x-values for the function evaluations are 1, 3, 5, and 7.
- 💡 The video proceeds to evaluate the sigma notation, calculating the area under the curve as an approximation, resulting in the value 24.8.
- 📝 The result, 24.8, is an approximation of the area under the curve for x between 0 and 8, using the method of rectangles.
Q & A
What is the main goal of the video?
-The main goal of the video is to practice approximating the area under curves using rectangles and to gain familiarity with the sigma notation in this context.
What function is represented by the curve in the video?
-The function represented by the curve is f(x) = 1 + 0.1x^2.
How is the area under the curve approximated in the video?
-The area under the curve is approximated by dividing it into four equal rectangles, using the midpoint of each interval to determine the height of the rectangles.
What is the width of each rectangle used in the approximation?
-The width of each rectangle is 2 units.
How are the heights of the rectangles determined?
-The heights of the rectangles are determined by the value of the function f at the midpoint of each interval (2n - 1), where n is the index of the rectangle.
What is the sigma notation for the sum of the areas of the rectangles?
-The sigma notation for the sum of the areas of the rectangles is ∑ (from n=1 to 4) of 2(f(2n - 1)).
What is the relationship between the index n and the x-value used to find the height of the rectangles?
-The relationship between the index n and the x-value used to find the height of the rectangles is given by the formula 2n - 1, where n is the index of the rectangle and the x-value is the argument of the function f.
How is the sum of the areas of the rectangles evaluated in the video?
-The sum of the areas of the rectangles is evaluated by calculating the value of the function f at the midpoint of each interval (1, 3, 5, and 7), multiplying each by 2, and then summing these values.
What is the final approximation of the area under the curve obtained in the video?
-The final approximation of the area under the curve obtained in the video is 24.8 square units.
What is the significance of the midpoint rule used for approximation in this video?
-The midpoint rule is a simple and intuitive method for approximating the area under a curve. It provides a reasonable approximation, especially when the number of rectangles (or subintervals) is increased, leading to a more precise estimate of the actual area.
How does the sigma notation help in representing the sum of the areas of the rectangles?
-The sigma notation is a concise way to represent the sum of a sequence of terms. In this context, it helps to compactly express the sum of the areas of the rectangles, making the mathematical expression easier to understand and manipulate.
Outlines
📊 Introduction to Approximating Area Under Curves and Sigma Notation
The paragraph introduces the objective of the video, which is to practice approximating the area under curves using rectangles and to become familiar with sigma notation in this context. The video presents a graph of the function f(x) = 1 + 0.1x^2 and demonstrates how to approximate the area under the curve between x=0 and x=8 by dividing it into four rectangles. Each rectangle has a width of 2 units and the height is determined by the function's value at the midpoint of the rectangle's interval. The speaker encourages viewers to pause the video and attempt to write the sigma notation for the sum of the areas of these rectangles before continuing.
📈 Evaluating the Sum of Rectangles' Areas and Final Approximation
In this paragraph, the speaker continues the explanation of how to calculate the sum of the areas of the rectangles as an approximation of the area under the curve. The speaker clarifies that the sigma notation should account for the correct function values at the midpoints of the intervals, resulting in the formula 2 * (f(2n-1)) for n from 1 to 4. The speaker then proceeds to evaluate the expression by calculating the function values at the specified points (f(1), f(3), f(5), f(7)) and summing them up. The final approximation of the area under the curve is found to be 24.8, highlighting that this is a rough estimate using the given method of rectangles.
Mindmap
Keywords
💡Approximate
💡Sigma Notation
💡Area under Curve
💡Midpoint
💡Rectangles
💡Integration
💡Function
💡Interval
💡Summation
💡Width
💡Height
Highlights
The video's main goal is to practice approximating the area under curves using rectangles and to become familiar with sigma notation in this context.
The function f(x) = 1 + 0.1x^2 is graphed and used to demonstrate the approximation of its area under the curve from x=0 to x=8.
The interval from 0 to 8 is divided into four equal parts, each with a width of 2, resulting in four rectangles for the approximation.
The height of each rectangle is determined by the value of the function f(x) at the midpoint of the respective interval.
The sigma notation is introduced to represent the sum of the areas of the rectangles as an approximation of the area under the curve.
The first rectangle's height corresponds to f(1), the second to f(3), the third to f(5), and the fourth to f(7), based on their midpoints.
The relationship between the rectangle's height and the value of n in the sigma notation is f(2n - 1), where n represents the rectangle number.
The final sigma notation for the approximation of the area is ∑ for n from 1 to 4 of 2(f(2n - 1)).
The area under the curve is approximated by evaluating the sigma notation, which results in a sum of terms 2(f(1) + 2f(3) + 2f(5) + 2f(7)).
The evaluation of f(x) at the given points results in the values 1.1, 1.9, 3.5, and 5.9, which are used in the final calculation.
The sum of the evaluated terms from the sigma notation yields an approximation of 12.4, which is then multiplied by 2 to get the final area approximation.
The final approximation of the area under the curve between x=0 and x=8 is 24.8.
This method of approximation is useful for those learning calculus and understanding the fundamental theorem of calculus.
The video provides a practical example of how to apply mathematical concepts to real-world problems, such as calculating areas under curves.
The use of rectangles and sigma notation is an introduction to Riemann sums, which are foundational in the study of integration.
The video demonstrates the importance of understanding the relationship between the function values and the intervals for accurate approximations.
The process shown in the video can be applied to more complex functions and intervals, providing a versatile method for approximating areas under curves.
Transcripts
Browse More Related Video

Riemann approximation introduction | Accumulation and Riemann sums | AP Calculus AB | Khan Academy

Riemann sums in summation notation | Accumulation and Riemann sums | AP Calculus AB | Khan Academy
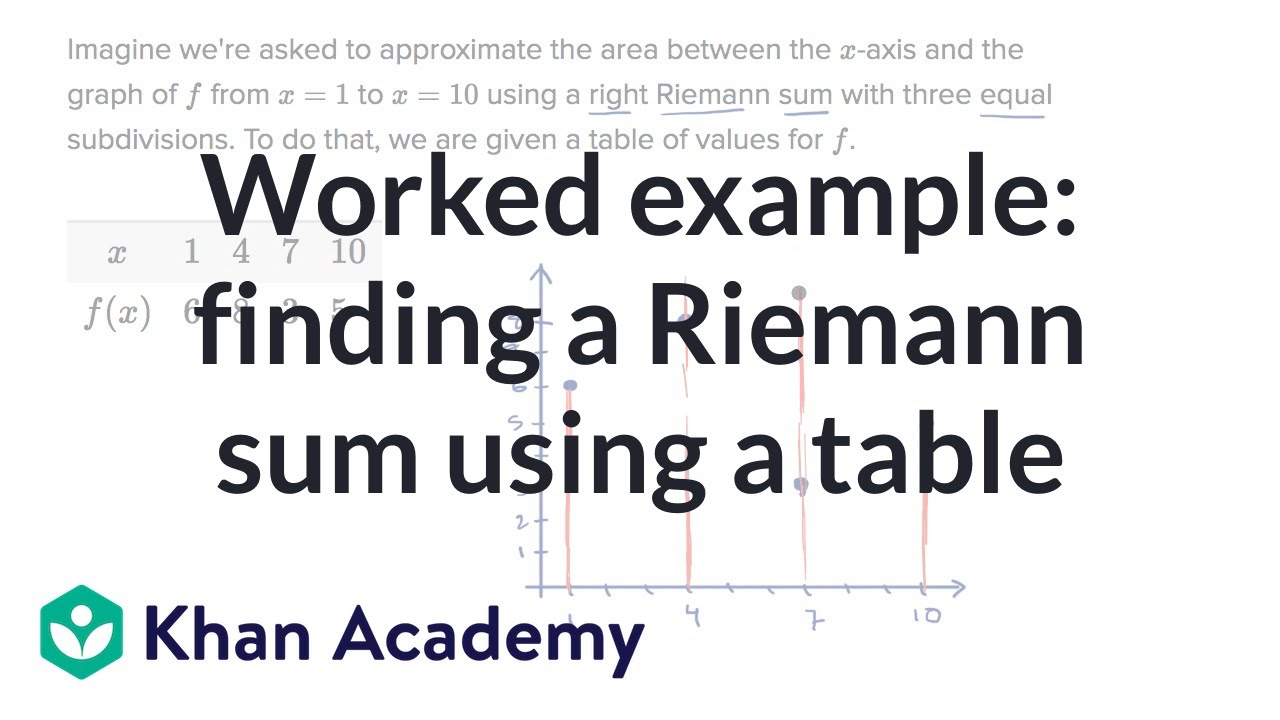
Worked example: finding a Riemann sum using a table | AP Calculus AB | Khan Academy
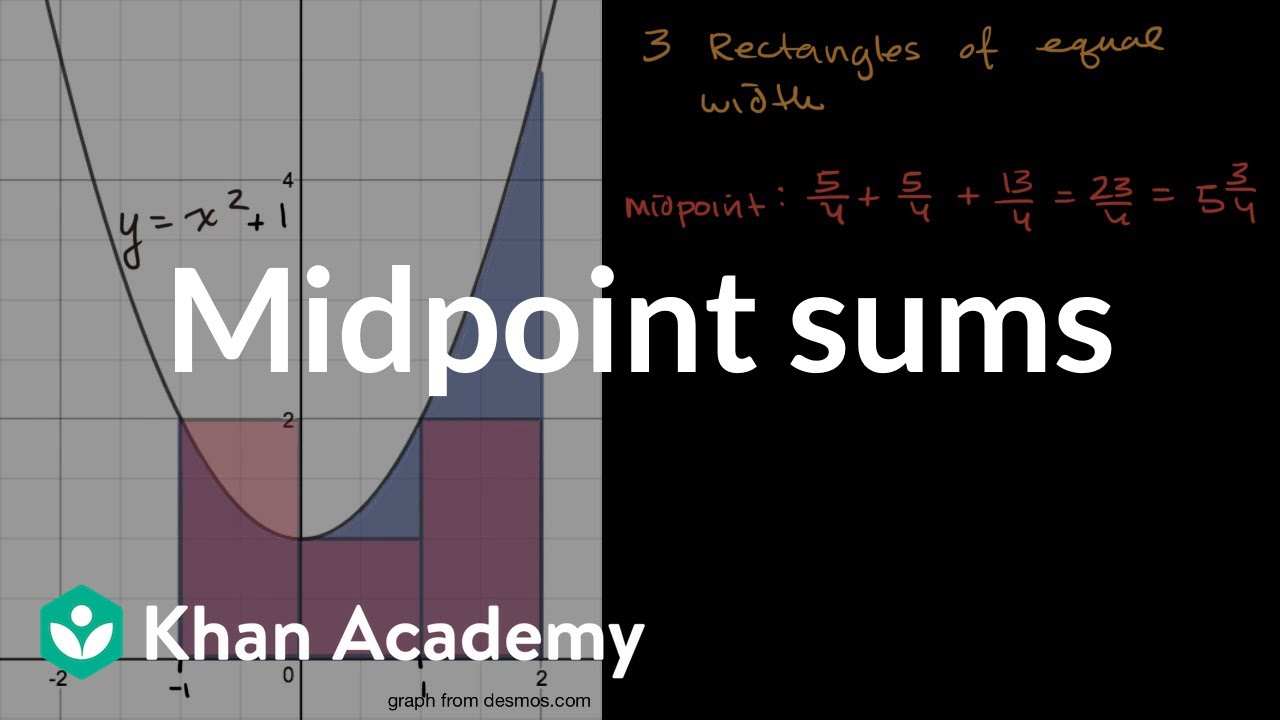
Midpoint sums | Accumulation and Riemann sums | AP Calculus AB | Khan Academy
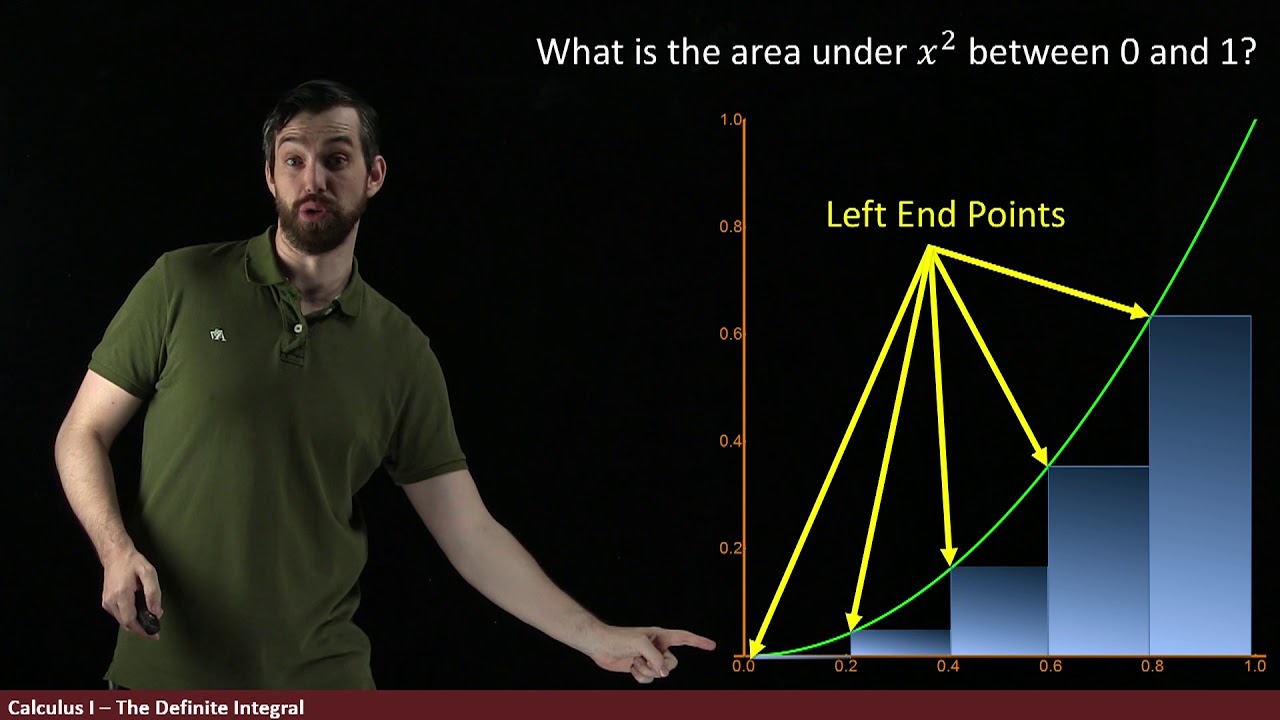
The Definite Integral Part I: Approximating Areas with rectangles
The Trapezoid Rule for Approximating Integrals
5.0 / 5 (0 votes)
Thanks for rating: