Riemann approximation introduction | Accumulation and Riemann sums | AP Calculus AB | Khan Academy
TLDRThis video demonstrates a method for approximating the area under a curve using rectangles. The specific function y = x^2 + 1 is considered over the interval from x = 1 to x = 3. By dividing the interval into four equal parts and constructing rectangles with widths corresponding to these intervals, the video shows how to calculate the area under the curve. The height of each rectangle is determined by the function's value at the left boundary. The total approximate area is found by summing the areas of the individual rectangles, providing a clear, visual, and intuitive understanding of the integral concept.
Takeaways
- 📈 The video demonstrates how to approximate the area under a curve using rectangles.
- 📐 The curve in question is y = x^2 + 1, and the interval is from x=1 to x=3.
- 🔍 Four rectangles of equal width (delta x) are constructed under the curve for the approximation.
- 🎨 The width (delta x) is determined by dividing the total x-distance (from 1 to 3) by the number of rectangles.
- 📏 The height of each rectangle is defined by the function value at the left boundary of that rectangle.
- 🧩 The first rectangle's height is f(1) = 1^2 + 1 = 2, and its area is 2 times delta x.
- 🧩 The second rectangle's height is f(1.5) = 1.5^2 + 1 = 3.25, and its area is 3.25 times delta x.
- 🧩 The third rectangle's height is f(2) = 2^2 + 1 = 5, and its area is 5 times delta x.
- 🧩 The fourth rectangle's height is f(2.5) = 2.5^2 + 1 = 7.25, and its area is 7.25 times delta x.
- 🤔 The approximation is not perfect and underestimates the true area due to the trapezoidal shape of the actual area under the curve.
- 🔢 The total approximate area is calculated by summing the areas of the rectangles and factoring out the common delta x.
- 🚀 Future videos will explore more advanced techniques for approximating areas under curves, including different shapes and placements of rectangles.
Q & A
What is the main goal of the video?
-The main goal of the video is to approximate the area under the curve y = x^2 + 1 between the intervals x = 1 and x = 3 using four rectangles of equal width.
How are the rectangles constructed under the curve?
-The rectangles are constructed by dividing the interval from x = 1 to x = 3 into four equal parts horizontally and using the function's value at the left boundary of each interval as the height of the rectangle.
What is the width (delta x) of each rectangle?
-The width (delta x) of each rectangle is 0.5, as the total interval (3 - 1) is divided into four equal parts.
How is the height of each rectangle determined?
-The height of each rectangle is determined by evaluating the function y = x^2 + 1 at the left boundary of the rectangle.
What is the area of the first rectangle?
-The area of the first rectangle is the function value at x = 1 (which is 2) times the width (delta x), so it's 2 * 0.5 = 1.
What is the area of the second rectangle?
-The area of the second rectangle is the function value at x = 1.5 (which is 3.25) times the width, so it's 3.25 * 0.5 = 1.625.
What is the area of the third rectangle?
-The area of the third rectangle is the function value at x = 2 (which is 5) times the width, so it's 5 * 0.5 = 2.5.
What is the area of the fourth rectangle?
-The area of the fourth rectangle is the function value at x = 2.5 (which is 7.25) times the width, so it's 7.25 * 0.5 = 3.625.
What is the total approximate area under the curve using the sum of the rectangles?
-The total approximate area under the curve is the sum of the areas of the four rectangles, which is 1 + 1.625 + 2.5 + 3.625 = 8.75.
Why is the approximation using rectangles an underestimate?
-The approximation is an underestimate because the rectangles are constructed using the left boundary function values, which do not account for the entire area under the curve, especially the portions that extend beyond the left boundary.
How might the approximation be improved in future videos?
-In future videos, the approximation might be improved by using a larger number of rectangles, different methods to define the height (such as using the right boundary or the midpoint), or by using shapes other than rectangles, like trapezoids.
Outlines
📊 Approximating the Area Under a Curve with Rectangles
This paragraph introduces the method of approximating the area under a curve y = x^2 + 1 between x=1 and x=3 using four rectangles of equal width. The rectangles are constructed under the curve, and the width (delta x) is determined by dividing the total x-distance (from 1 to 3) by the number of rectangles (4). The height of each rectangle is defined by the function's value at the left boundary. The first rectangle has a height of f(1) = 1^2 + 1 = 2, the second f(1.5) = 1.5^2 + 1 = 3.25, the third f(2) = 2^2 + 1 = 5, and the fourth f(2.5) = 2.5^2 + 1 = 7.25. The total approximate area is calculated by summing the areas of the rectangles, which is f(1) * delta x + f(1.5) * delta x + f(2) * delta x + f(2.5) * delta x. The approximation is acknowledged as an underestimate, as it leaves out some area under the curve.
🔢 Simplifying the Calculation and Future Generalization
In this paragraph, the calculation of the approximate area is simplified by factoring out the common term 1/2, resulting in the equation 1/2 * (2 + 3.25 + 5 + 7.25). The mental arithmetic leads to the total sum of 17.5, and when multiplied by 1/2, gives an approximate area of 8.75. The video script notes that this is an underestimate but serves as a basic approximation. The script also mentions that future videos will explore generalizing this method for arbitrary functions and varying numbers of rectangles, as well as considering different ways to define the height of the rectangles, such as using the right boundary or the midpoint, and possibly employing trapezoids instead of rectangles.
Mindmap
Keywords
💡Approximation
💡Curve
💡Rectangles
💡Delta X
💡Function
💡Left Boundary
💡Area
💡Integration
💡Underestimate
💡Trapezoids
💡Midpoint
Highlights
The video aims to approximate the area under the curve y = x^2 + 1 between x = 1 and x = 3 using rectangles.
Four rectangles of equal width are constructed under the curve for the approximation.
The width of the rectangles, denoted as delta x, is determined by the total distance traveled in x, divided by the number of rectangles.
The height of each rectangle is defined by the function evaluated at the left boundary.
The first rectangle has a height of f(1) = 1^2 + 1 = 2.
The second rectangle's height is f(1.5) = 1.5^2 + 1 = 3.25.
The third rectangle's height is f(2) = 2^2 + 1 = 5.
The fourth rectangle's height is f(2.5) = 2.5^2 + 1 = 7.25.
The total approximate area under the curve is the sum of the areas of the rectangles.
The approximation will be an underestimate since it gives up some area under the curve.
The concept will be generalized to arbitrary functions and a variable number of rectangles in future videos.
Different methods for defining the height of rectangles, such as by the right boundary or the midpoint, will be explored.
Alternative shapes like trapezoids may be considered for approximation instead of rectangles.
The approximation method demonstrated is a fundamental concept in calculus, specifically integral calculus.
The video provides a visual and mathematical explanation of the Riemann sum, a key concept in understanding definite integrals.
The process of approximating the area under a curve is a practical application of mathematical concepts in understanding the behavior of functions.
The step-by-step construction and evaluation of the rectangles serve as a basic introduction to the method of approximating integrals.
The video content is designed to build a foundation for more advanced topics in calculus, such as the Fundamental Theorem of Calculus.
Transcripts
Browse More Related Video

Riemann sums in summation notation | Accumulation and Riemann sums | AP Calculus AB | Khan Academy

Worked example: Riemann sums in summation notation | AP Calculus AB | Khan Academy
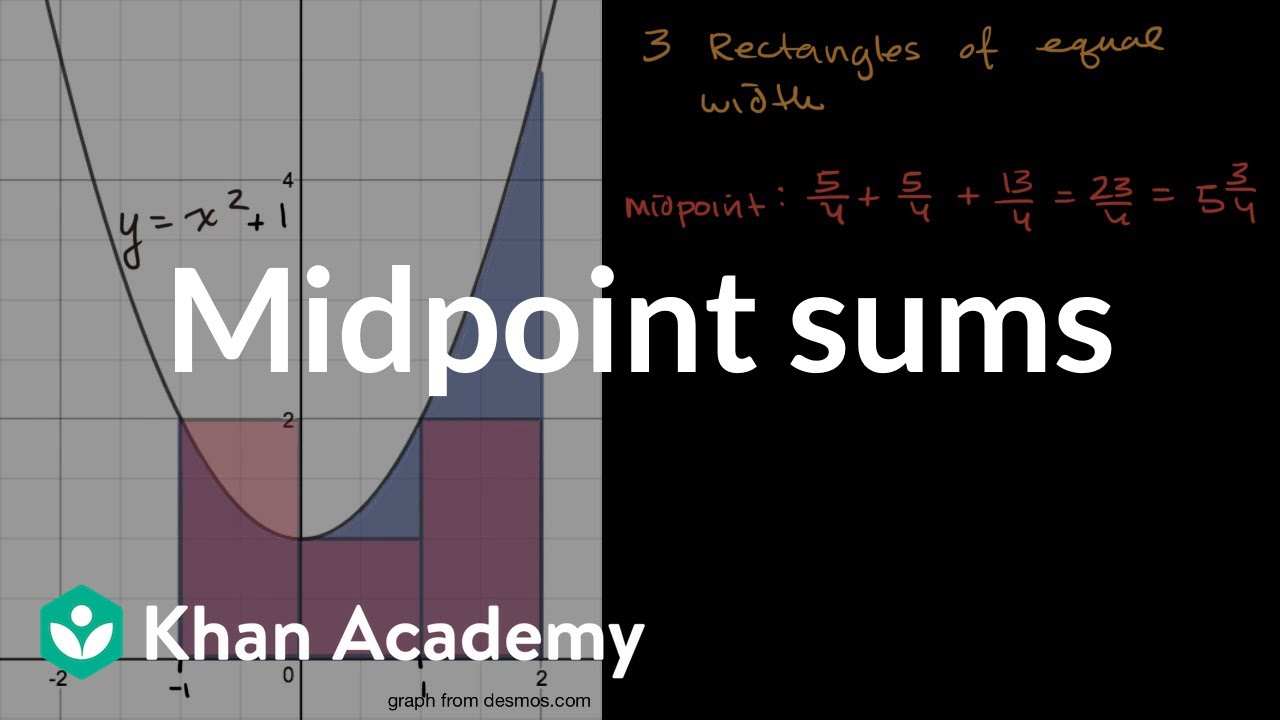
Midpoint sums | Accumulation and Riemann sums | AP Calculus AB | Khan Academy

Calculus - Lesson 13 | Integral of a Function | Don't Memorise
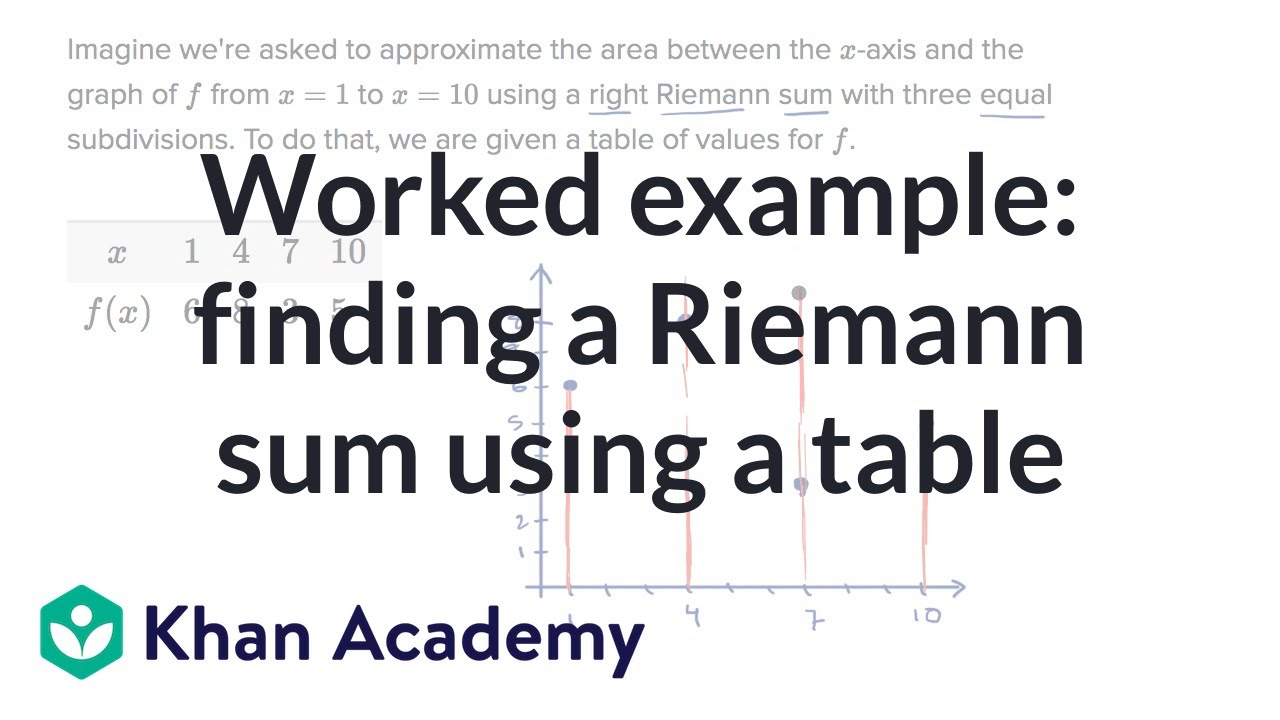
Worked example: finding a Riemann sum using a table | AP Calculus AB | Khan Academy

Approximating Area Under the Curve, Using Rectangles
5.0 / 5 (0 votes)
Thanks for rating: