Hypothesis Test vs. Confidence Interval | Statistics Tutorial #15 | MarinStatsLectures
TLDRThis script discusses the relationship between hypothesis testing and confidence intervals, focusing on a one-variable, two-sided approach with a 5% alpha level and 95% confidence. It explains that hypothesis testing involves comparing a sample mean to a null value, calculating a test statistic and p-value to determine if there's evidence against the null hypothesis. Confidence intervals, on the other hand, provide a range of plausible values for the population mean. The script emphasizes that both methods should yield consistent conclusions when correctly applied, and suggests reporting both to understand the strength of evidence and plausible population values.
Takeaways
- 📊 Hypothesis tests and confidence intervals are related statistical methods used for analyzing data.
- 🎯 In hypothesis testing, we assume a population mean equals a null value and compare it to the sample mean using a test statistic and p-value.
- 🔍 A two-sided hypothesis test with an alpha of 5% helps decide whether to reject or not the null hypothesis based on the p-value.
- 📈 A confidence interval at 95% provides a range of plausible values for the population mean based on the sample mean and margin of error.
- 💡 If the null hypothesis falls within the confidence interval, the p-value will be greater than the alpha level (5% in this case).
- 🔗 When the null hypothesis is outside the confidence interval, the p-value will be less than 5%.
- 🌟 Both hypothesis testing and confidence intervals should agree on the conclusion if they are both two-sided and use the same alpha and confidence levels.
- 📋 Reporting both the p-value and confidence interval is beneficial as they provide complementary information about the evidence against the null hypothesis and plausible population values.
- 🔑 The p-value indicates the strength of the evidence against the null hypothesis, while the confidence interval offers a range of plausible values for the population mean.
- 🔍 These concepts apply to most confidence intervals and are not limited to the one-mean context discussed in the script.
Q & A
What is the primary assumption made in hypothesis testing?
-The primary assumption made in hypothesis testing is that the population mean is equal to some null value.
What is the purpose of calculating a test statistic in hypothesis testing?
-The purpose of calculating a test statistic is to determine how far the estimate is from the hypothesized value, which helps in making a decision to reject or not reject the null hypothesis.
What is a p-value in the context of hypothesis testing?
-A p-value is the probability of obtaining an estimate as extreme as, or more extreme than, the observed estimate if the null hypothesis is true.
How is the decision to reject or not reject the null hypothesis made in hypothesis testing?
-The decision is made by comparing the p-value to a predetermined alpha level. If the p-value is smaller than alpha, the null hypothesis is rejected; if it's larger, the null hypothesis is not rejected.
What is the relationship between a confidence interval and a hypothesis test?
-A confidence interval provides a range of plausible values for the population mean, and can be used as a hypothesis test by checking if the null hypothesis value falls within the interval. If it does, the p-value will be larger than alpha; if not, the p-value will be smaller than alpha.
How does the two-sided hypothesis test relate to the concept of confidence intervals?
-In a two-sided hypothesis test, the focus is on whether the sample mean deviates significantly from the hypothesized mean in either direction. This is similar to a confidence interval, which also considers the range of values within which the true mean is likely to fall, but from the perspective of the sample mean.
What is the recommended approach when reporting results of hypothesis testing and confidence intervals?
-It is recommended to report both the p-value and the confidence interval. The p-value provides information on the strength of evidence against the null hypothesis, while the confidence interval gives a range of plausible values for the population mean.
What is the significance of the alpha level in hypothesis testing?
-The alpha level, often set at 5%, is the threshold for deciding whether to reject the null hypothesis. A p-value less than alpha indicates that there is enough evidence to reject the null hypothesis.
How does the concept of a margin of error relate to confidence intervals?
-The margin of error in a confidence interval represents the additional value added to the sample mean to account for uncertainty. It is typically calculated as roughly two standard errors above and below the sample mean.
What happens if the null hypothesis value falls outside the confidence interval?
-If the null hypothesis value falls outside the confidence interval, the p-value will be less than the alpha level, leading to the rejection of the null hypothesis.
Why is it important to understand both hypothesis testing and confidence intervals?
-Understanding both hypothesis testing and confidence intervals is important because they provide complementary perspectives on the data. Hypothesis testing focuses on the evidence against a null hypothesis, while confidence intervals provide a range of plausible values for the population parameter, enhancing the overall understanding of the data.
Outlines
📊 Hypothesis Testing and Confidence Intervals
This paragraph discusses the relationship between hypothesis tests and confidence intervals in the context of a numeric variable's mean. It explains the process of hypothesis testing, starting with an assumption about the population mean (null value), calculating a test statistic, and obtaining a p-value to compare against a predetermined alpha level (5% in this case). The paragraph then contrasts this with confidence intervals, which involve adding a margin of error to an estimate and using it to infer the possible range for the population mean. The speaker emphasizes that both methods should yield the same conclusion when applied correctly, with the p-value indicating the strength of evidence against the null hypothesis, and the confidence interval providing a plausible range for the population mean.
🎥 Video Content and Engagement
The second paragraph appears to be unrelated to the statistical discussion of the first paragraph. It seems to be a casual remark or an attempt to engage the audience, mentioning 'Huizar knots' and 'truck' which could be references to food or a local event. The speaker encourages the audience to stick around, suggesting that more interesting content is coming up, possibly related to a certificate or an achievement.
Mindmap
Keywords
💡hypothesis tests
💡confidence intervals
💡two-sided hypothesis test
💡alpha level
💡p-value
💡sample mean
💡standard error
💡population mean
💡margin of error
💡test statistic
💡statistical significance
Highlights
The discussion revolves around hypothesis tests and confidence intervals, and their relationship.
The focus is on one numeric variable and a mean, with a two-sided hypothesis test and a 95% confidence interval.
A hypothesis test assumes that the population mean is equal to a null value and uses a test statistic to measure the deviation.
The p-value is compared to alpha (5% in this case) to decide whether to reject the null hypothesis.
Confidence intervals involve adding a margin of error to the sample estimate.
Both hypothesis testing and confidence intervals require data collection and can be used to test a hypothesis or build a confidence interval.
The sampling distribution describes the distribution of all possible sample means if the null hypothesis is true.
A two-sided hypothesis test examines the likelihood of obtaining an estimate as extreme as the observed one.
The p-value represents the probability of getting an estimate as far or further from the hypothesized value.
If the p-value is less than alpha, the null hypothesis is rejected; otherwise, it is not rejected.
In a confidence interval, the sample mean is the point of reference, with a margin of error added.
The null hypothesis value can be checked against the confidence interval to see if it falls within the range.
If the null value falls within the confidence interval, the p-value will be greater than alpha; if outside, the p-value will be less than alpha.
Hypothesis testing and confidence intervals will agree in their conclusions if both are two-sided and use the specified alpha and confidence levels.
Reporting both the p-value and confidence interval is recommended as they provide complementary information.
The p-value indicates the strength of evidence against the null hypothesis, while the confidence interval provides a range of plausible values for the population mean.
These concepts apply to most confidence intervals and help reach the same conclusion as a hypothesis test, albeit from different points of reference.
Transcripts
Browse More Related Video

What is a Hypothesis Test and a P-Value? | Puppet Master of Statistics
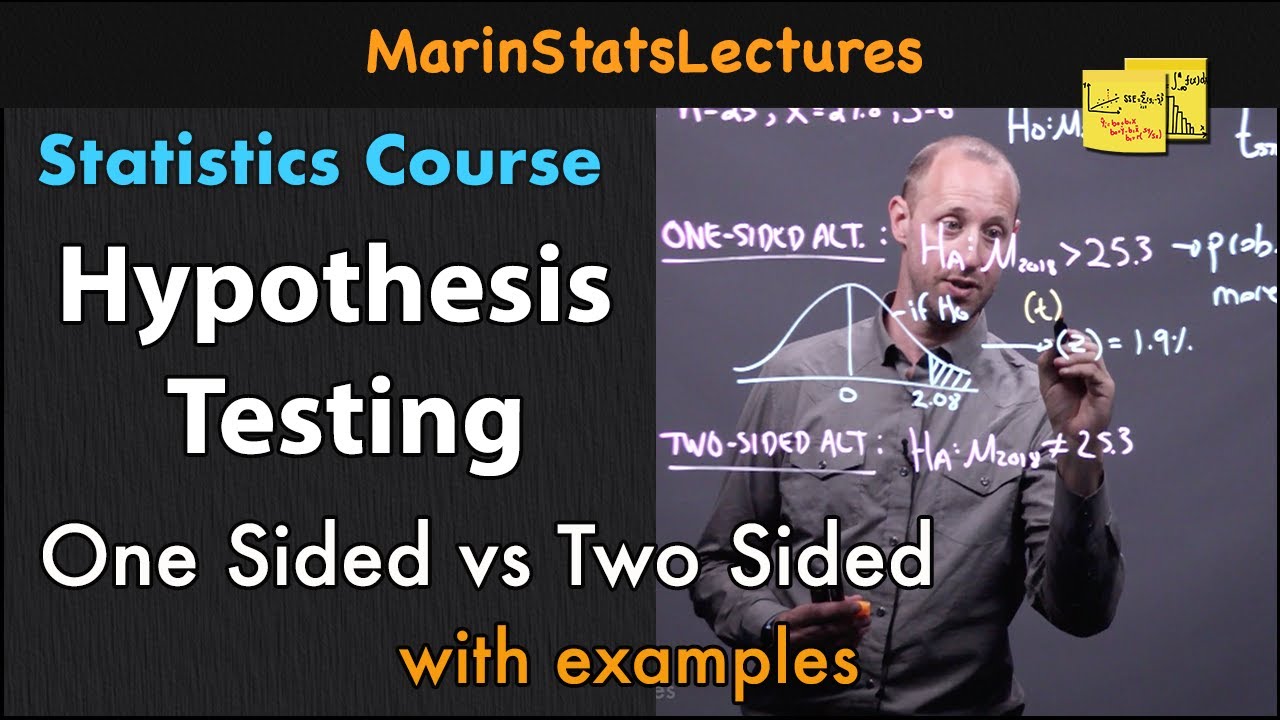
Hypothesis Testing: One Sided vs Two Sided Alternative | Statistics Tutorial #14 |MarinStatsLectures
Using StatCrunch to perform hypothesis testing on two matched pair means of acting award ages
Confidence Intervals: Crash Course Statistics #20
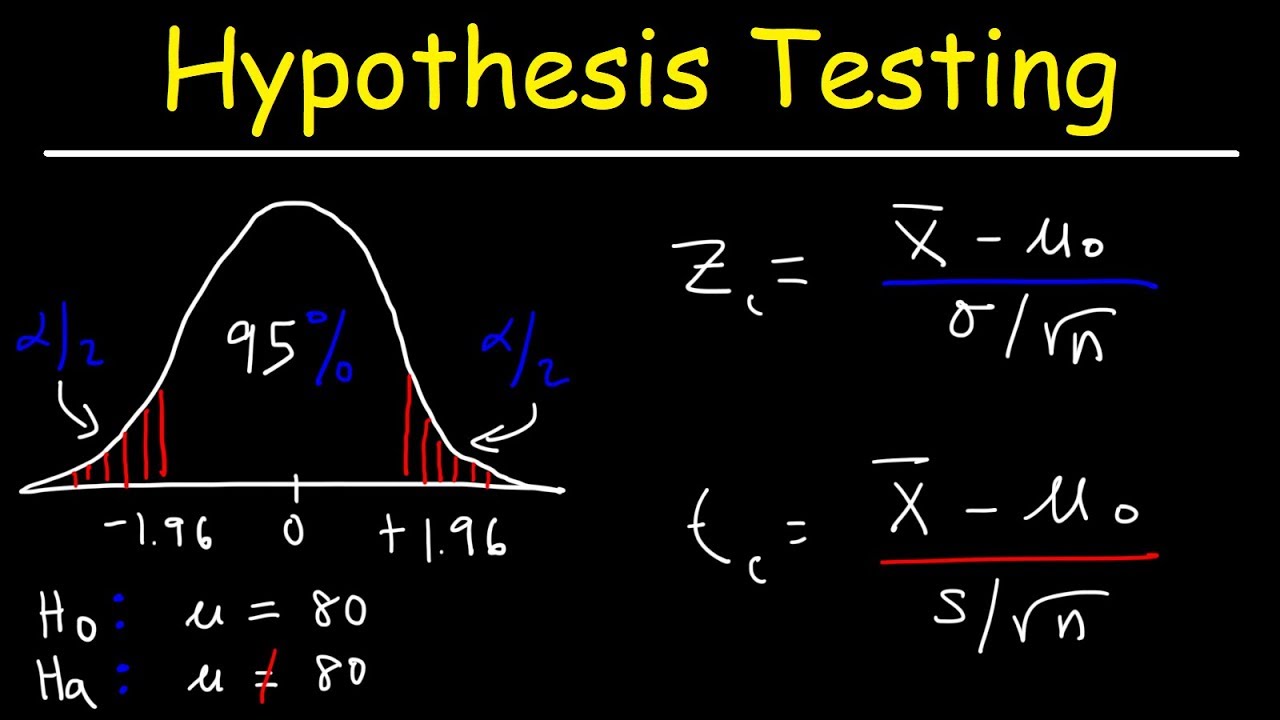
Hypothesis Testing Problems - Z Test & T Statistics - One & Two Tailed Tests 2
Statistical Significance and p-Values Explained Intuitively
5.0 / 5 (0 votes)
Thanks for rating: