What is a Hypothesis Test and a P-Value? | Puppet Master of Statistics
TLDRIn this video, Mike Mary explains hypothesis testing for a population mean using a one-sample test. He uses an example of measuring fish lengths in a lake to determine if fishing can commence based on a mean length exceeding 35 cm. The process involves calculating a sample mean, understanding p-values, and constructing confidence intervals. Mike emphasizes the importance of using both p-values and confidence intervals for robust conclusions. He concludes with advice on testing hypotheses involving relationships between variables. Don't forget to check out the accompanying statistical visualizations linked in the description.
Takeaways
- 🔍 The video discusses the concept of a hypothesis test for a population mean, specifically a one-sample t-test.
- 🐟 The context provided is about sustainable fishing regulations and the need to ensure the mean length of fish in a lake is greater than 35 centimeters.
- 📊 A random sample of 25 fish with a sample mean length of 41 centimeters and a sample standard deviation of 12 centimeters is used to estimate the population mean.
- 🎯 The goal is to determine if there is convincing evidence that the true mean length of fish is greater than 35 centimeters to justify fishing.
- ❓ The video poses the question of whether the sample mean of 41 centimeters is greater than 35 by chance or if it reflects a true population mean.
- 🧐 The null hypothesis (H0) is assumed to be true, stating that the true mean length of fish is 35 centimeters.
- 📉 The p-value, which measures the compatibility of the sample estimate with the null hypothesis, is calculated and found to be approximately 1%.
- 🚫 A p-value less than 5% typically leads to the rejection of the null hypothesis, suggesting strong evidence against the assumed value.
- 📊 The video suggests constructing a 95% confidence interval for the mean to strengthen the analysis, which in this case is between 36.2 to 45.8 centimeters.
- 🔑 The confidence interval does not overlap with the null value, supporting the conclusion that the true mean is greater than 35 centimeters.
- 🔍 The video also mentions that hypothesis testing can be applied to summarize relationships between two or more variables, not just means.
Q & A
What is the main topic of the video?
-The main topic of the video is the concept of a hypothesis test for a population mean, specifically a one-sample t-test.
Why is it important to test the hypothesis about the true population mean?
-It is important to test the hypothesis about the true population mean to provide convincing evidence for claims or decisions, such as the sustainable fishing regulations example where the mean fish length must be greater than 35 centimeters to begin fishing.
What is the null hypothesis in the context of the video?
-The null hypothesis in the context of the video is that the true mean length of fish in the lake is 35 centimeters.
What is a p-value and why is it significant in hypothesis testing?
-A p-value is a measure of how compatible the sample estimate is with the assumed value under the null hypothesis. It is significant because it helps determine if there is enough evidence to reject the null hypothesis.
What is the p-value calculated in the video, and what does it suggest?
-The p-value calculated in the video is approximately 1%, suggesting that there is a strong indication that the true mean length of fish is greater than 35 centimeters, as it is unlikely to have obtained the sample mean of 41 centimeters by chance alone.
What is the general rule of thumb for rejecting the null hypothesis based on the p-value?
-The general rule of thumb for rejecting the null hypothesis is if the p-value is less than 5%.
Why is the 5% cutoff used as a standard for rejecting the null hypothesis?
-The 5% cutoff is used as a standard for rejecting the null hypothesis because Sir Ronald Fisher suggested it as a reasonable cut point, and it has become widely accepted in the statistical community.
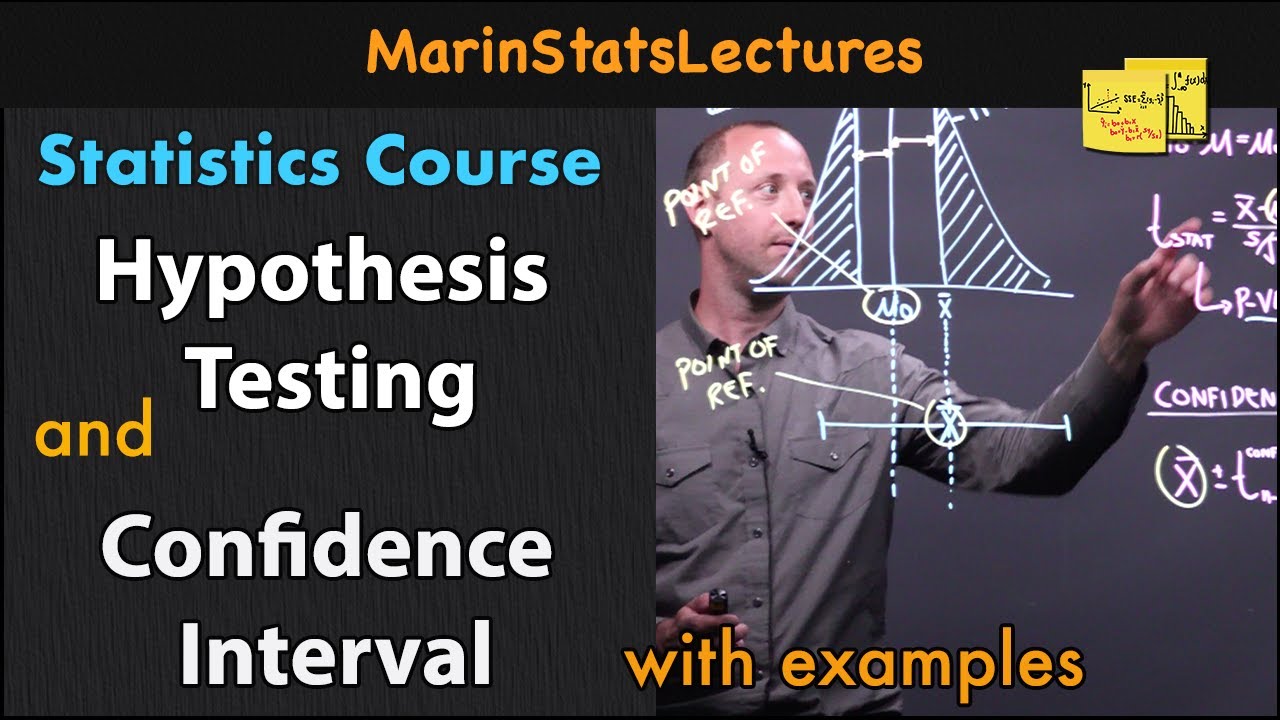
What is a confidence interval and how does it relate to the hypothesis test in the video?
-A confidence interval is a range within which we are a certain percentage confident that the true population parameter lies. In the video, a 95% confidence interval for the mean fish length is calculated, which supports the conclusion that the true mean is greater than 35 centimeters.
What is the range of the 95% confidence interval for the true mean length of fish in the lake as presented in the video?
-The 95% confidence interval for the true mean length of fish in the lake is between 36.2 and 45.8 centimeters.
Why is it important to construct a confidence interval in addition to relying on the p-value?
-Constructing a confidence interval in addition to relying on the p-value is important because the p-value does not provide information about the precision of the estimate. A confidence interval gives a range of plausible values for the parameter, which strengthens the analysis.
What additional type of hypothesis testing is mentioned in the video, and how does it differ from the one-sample t-test?
-The video mentions testing hypotheses on estimates that summarize the relationship between two or more variables. This differs from the one-sample t-test as it involves more than one variable and typically requires different statistical methods such as ANOVA or regression analysis.
Outlines
🐟 Hypothesis Testing for Population Mean
This paragraph introduces the concept of a hypothesis test for a population mean, specifically a one-sample t-test. The context provided is a lake with fish that must reach a minimum length before fishing is allowed. The sample mean length of 41 centimeters from a sample of 25 fish is compared against the hypothesized population mean of 35 centimeters. The discussion revolves around the idea of providing evidence that the true mean length is greater than the regulation, using the sample data to calculate a p-value. The p-value, which is approximately 1%, indicates the rarity of obtaining such a sample mean if the true mean were indeed 35 centimeters. This leads to the rejection of the null hypothesis, suggesting that the true mean is likely greater than the regulatory threshold.
📊 Statistical Decision Making and Confidence Intervals
The second paragraph delves into the implications of the p-value and the decision-making process in hypothesis testing. It emphasizes the common threshold of 5% for rejecting the null hypothesis, attributed to Sir Ronald Fisher, and discusses the arbitrariness of this choice. The paragraph also highlights the importance of not solely relying on the p-value by introducing the concept of confidence intervals. A 95% confidence interval for the mean length of fish is provided, ranging from 36.2 to 45.8 centimeters, which supports the conclusion from the hypothesis test. Additionally, the paragraph mentions the relevance of hypothesis testing for relationships between variables and encourages viewers to explore accompanying statistical visualizations for a deeper understanding.
Mindmap
Keywords
💡Hypothesis Test
💡Population Mean
💡Sample Mean
💡Standard Deviation
💡Null Hypothesis
💡P-Value
💡Significance Level
💡Confidence Interval
💡Sustainable Fishing
💡Statistical Visualization
Highlights
Introduction to hypothesis testing for a population mean, known as a one-sample test.
Use of data to estimate population parameters, such as the mean of a variable.
Hypothesis testing to validate claims about the true population mean.
Example of sustainable fishing regulations and the hypothesis test for the mean length of fish.
Random sampling of 25 fish with a sample mean length of 41 centimeters.
Understanding sample means and their variation around the true mean.
The importance of providing evidence for the mean length of fish being greater than 35 centimeters.
Assumption of the null hypothesis that the true mean length of fish is 35 centimeters.
Utilization of the sample standard deviation to estimate the standard error of the mean.
Concept of the p-value as a measure of compatibility between sample estimate and null hypothesis.
Calculation of the p-value to determine the probability of obtaining a sample mean of 41 centimeters or more.
Interpretation of the p-value and its implications for the null hypothesis.
Decision to reject the null hypothesis based on a p-value of 1%, suggesting the true mean is greater than 35 centimeters.
The 5% cutoff as a general rule of thumb for rejecting the null hypothesis, attributed to Sir Ronald Fisher.
Construction of a 95% confidence interval to strengthen the analysis of the mean length of fish.
Conclusion that the true mean length is likely greater than 35 centimeters based on the confidence interval.
Caution against relying solely on the p-value and the importance of considering the precision of the estimate.
Expansion of hypothesis testing to include relationships between variables.
Invitation to explore accompanying statistical visualizations for a deeper understanding.
Transcripts
Browse More Related Video
Hypothesis Test vs. Confidence Interval | Statistics Tutorial #15 | MarinStatsLectures

What is a Confidence Interval? | Puppet Master of Statistics
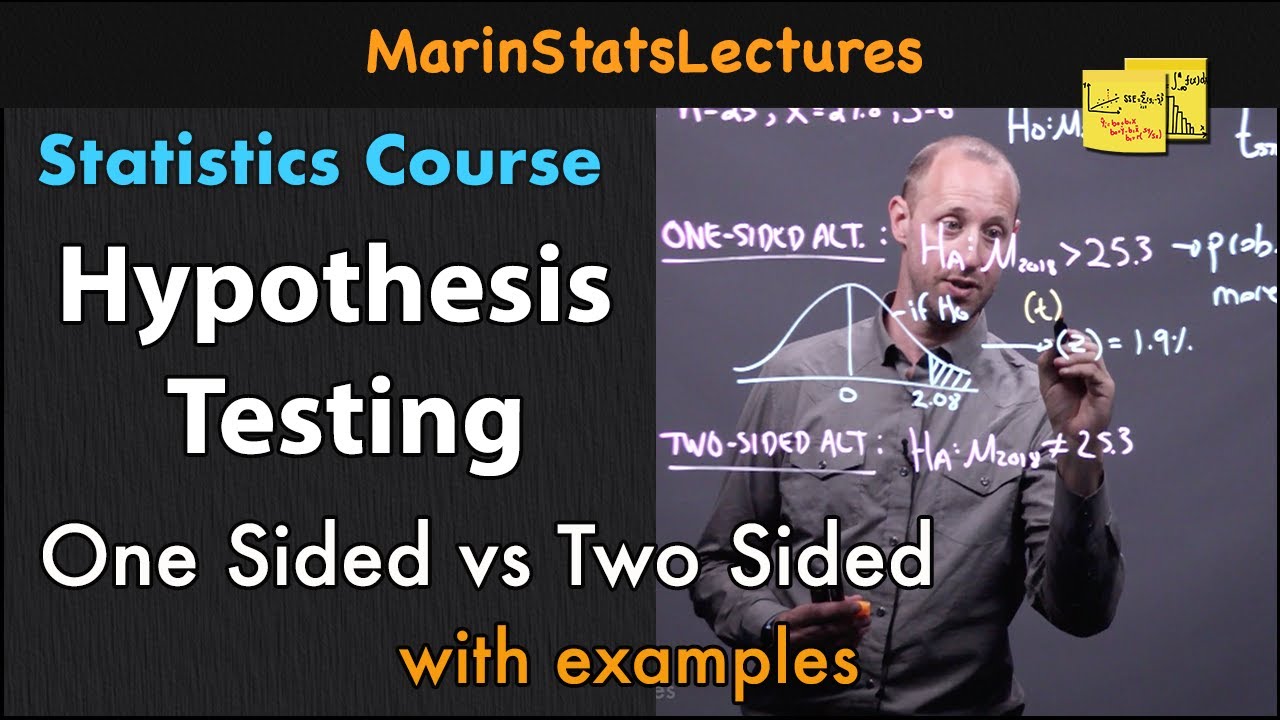
Hypothesis Testing: One Sided vs Two Sided Alternative | Statistics Tutorial #14 |MarinStatsLectures
One-Sample t Test & Confidence Interval in R with Example | R Tutorial 4.1| MarinStatsLectures
Hypothesis Testing: Calculations and Interpretations| Statistics Tutorial #13 | MarinStatsLectures
Two-Sample t Test in R (Independent Groups) with Example | R Tutorial 4.2 | MarinStatsLectures
5.0 / 5 (0 votes)
Thanks for rating: