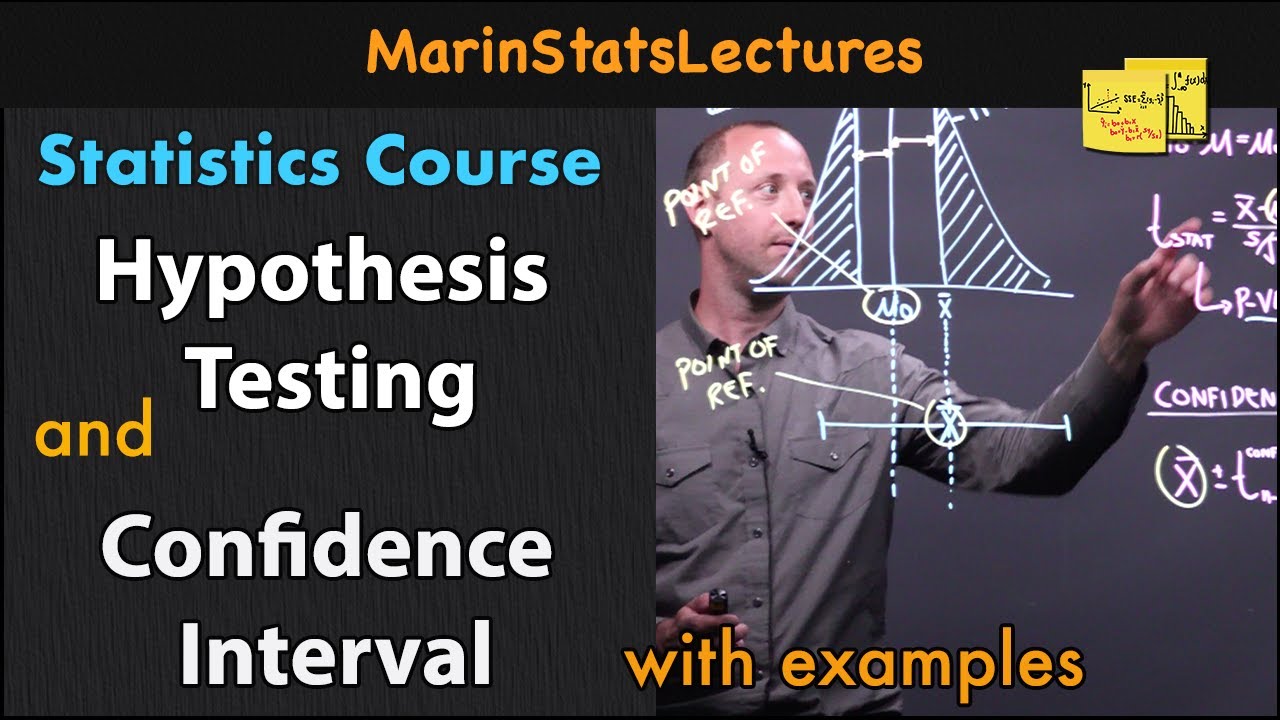
Hypothesis Testing: One Sided vs Two Sided Alternative | Statistics Tutorial #14 |MarinStatsLectures
TLDRThis transcript discusses the differences between one-sided and two-sided hypothesis testing in the context of comparing mean BMI values between 2008 and 2018. It explains the concept of null and alternative hypotheses, and how to interpret the p-values resulting from each test. The speaker emphasizes the importance of not solely relying on p-values, but also considering effect size, confidence intervals, sample size, and study design when making conclusions in research.
Takeaways
- 📈 The discussion revolves around the differences between one-sided and two-sided hypothesis tests, particularly in the context of comparing mean BMI values between 2008 and 2018.
- 🎯 The null hypothesis for the example is that the mean BMI in 2018 hasn't changed from the known 2008 value of 25.3.
- 🔍 A sample of 25 individuals yielded a mean BMI of 27.8 with a standard deviation of 6, which was used to calculate the test statistic.
- 📊 In the one-sided test, the alternative hypothesis is that the mean BMI in 2018 is greater than the 2008 mean, with a test statistic of 2.08 standard errors above the hypothesized value.
- 🌟 The one-sided p-value using Z-distribution is 1.9%, and using the t-distribution, it is 2.4%.
- 🔄 For the two-sided test, the alternative hypothesis is that the mean BMI in 2018 is not equal to the 2008 mean, considering deviations in both directions.
- 🤔 The two-sided p-value is essentially double the one-sided p-value, which in this case results in 4.8% when using the t-distribution.
- 🚨 It's emphasized that the p-value should not be the sole determinant in making research conclusions; instead, a holistic approach considering effect size, confidence intervals, sample size, power, and study design is recommended.
- 📝 The script advises against relying too heavily on the 5% alpha level as a cutoff for significance, as the context and other factors should also be taken into account.
- 🧐 The importance of considering the practical implications and the broader research question, rather than just the p-value, is highlighted.
- 🔎 The script encourages readers to look beyond the p-value and consider the entire statistical analysis, including the study's limitations and generalizability.
Q & A
What is the main topic of the transcript?
-The main topic of the transcript is the difference between one-sided and two-sided alternative hypothesis tests.
What was the known mean BMI in the US in 2008?
-The known mean BMI in the US in 2008 was 25.3.
What was the sample mean BMI found in the 2018 sample of 25 individuals?
-The sample mean BMI found in the 2018 sample was 27.8.
What was the sample standard deviation in the 2018 sample?
-The sample standard deviation in the 2018 sample was 6.
What is the null hypothesis for the one-sided test?
-The null hypothesis for the one-sided test is that the mean in 2018 hasn't changed from the 2008 mean of 25.3.
What is the alternative hypothesis for the one-sided test?
-The alternative hypothesis for the one-sided test is that the mean in 2018 is now greater than the mean of 2008.
What is the test statistic for the example given?
-The test statistic for the example given is 2.08s, which represents 2.08 standard errors above the hypothesized value.
What is the p-value for the one-sided test using Z distribution?
-The p-value for the one-sided test using Z distribution is 1.9%.
What is the p-value for the one-sided test using the t-distribution?
-The p-value for the one-sided test using the t-distribution is 2.4%.
How does the two-sided test differ from the one-sided test?
-The two-sided test considers the possibility of the mean being either greater than or less than the hypothesized value, whereas the one-sided test only considers one direction of deviation.
What is the p-value for the two-sided test using the Z distribution?
-The p-value for the two-sided test using the Z distribution is double the one-sided p-value, which is approximately 3.8%.
What is the significance of the p-value in hypothesis testing?
-The p-value helps determine the probability of observing the test results under the null hypothesis. A smaller p-value indicates stronger evidence against the null hypothesis, but it is not a definitive yes/no answer and should be considered alongside other factors such as effect size, sample size, and study design.
Outlines
📊 Understanding One-Sided vs Two-Sided Hypothesis Testing
This paragraph discusses the distinction between one-sided and two-sided hypothesis tests. It uses the example of testing whether the mean BMI in the US increased from 2008 to 2018. The null hypothesis posits no change, while the one-sided alternative hypothesis suggests an increase. The paragraph explains the concept of standard errors and how they are used to calculate the probability of obtaining a sample mean as extreme as the one observed, under the null hypothesis. It contrasts this with the two-sided test, which considers both directions of deviation from the null hypothesis value. The explanation includes the calculation of p-values for both tests and emphasizes that a two-sided p-value is essentially double the one-sided p-value. The paragraph concludes by highlighting that while p-values are useful, they should not be the sole basis for determining the significance of a research finding.
🧐 The Importance of Context Beyond P-Values in Statistical Analysis
This paragraph emphasizes the importance of considering context and multiple factors beyond just p-values when interpreting statistical results. It points out that a small p-value does not necessarily mean the null hypothesis is false, and a large p-value does not mean it is true. The paragraph discusses the limitations of using a single alpha level as a cutoff for significance and argues for a more nuanced approach that takes into account effect size, confidence intervals, sample size, study design, and data collection methods. It suggests that decisions about the harmfulness of exposures or the effectiveness of treatments should not rely solely on p-values but should be informed by a comprehensive evaluation of the study's methodology and findings.
Mindmap
Keywords
💡Hypothesis Test
💡Null Hypothesis
💡Alternative Hypothesis
💡Standard Error
💡One-Sided Test
💡Two-Sided Test
💡P-Value
💡Effect Size
💡Confidence Interval
💡Sample Size
💡Statistical Power
💡Research Question
Highlights
Exploring the differences between one-sided and two-sided hypothesis tests.
Using the example of BMI changes from 2008 to 2018 to illustrate the hypothesis testing process.
The null hypothesis states that the mean BMI in 2018 hasn't changed from the 2008 mean of 25.3.
The sample mean BMI in 2018 is found to be 27.8 with a sample standard deviation of 6.
The test statistic for the one-sided test is 2.08 standard errors above the hypothesized value.
In a one-sided test, the alternative hypothesis suggests the mean BMI in 2018 is greater than in 2008.
For the two-sided test, the alternative hypothesis suggests the mean BMI in 2018 is not equal to 25.3.
The one-sided test shows a 1.9% probability of observing a sample mean as extreme as 27.8 if the null hypothesis is true.
Using the t-distribution, the one-sided p-value is 2.4%, and for the two-sided test, it is 4.8%.
The two-sided test is considered more conservative and fair as it accounts for deviations in both directions.
The p-value in a two-sided test is essentially double the one-sided p-value.
The concept of p-value should not be the sole determinant in making research conclusions.
Effect size, confidence intervals, sample size, and study design are all crucial factors in interpreting research findings.
The American Statistical Association's statement on p-values provides a deeper discussion on their appropriate use.
Decisions on harm or benefit from exposures should not rely on a single p-value but on a comprehensive analysis.
The importance of considering the context and multiple factors when making decisions based on research findings.
The p-value is a useful tool but not definitive in determining the truth of a research question.
The discussion emphasizes the need to move beyond a single-number conclusion towards a more nuanced understanding of research outcomes.
Transcripts
Browse More Related Video
Hypothesis Test vs. Confidence Interval | Statistics Tutorial #15 | MarinStatsLectures
The basic steps of hypothesis testing
How to calculate p-values

What is a Hypothesis Test and a P-Value? | Puppet Master of Statistics
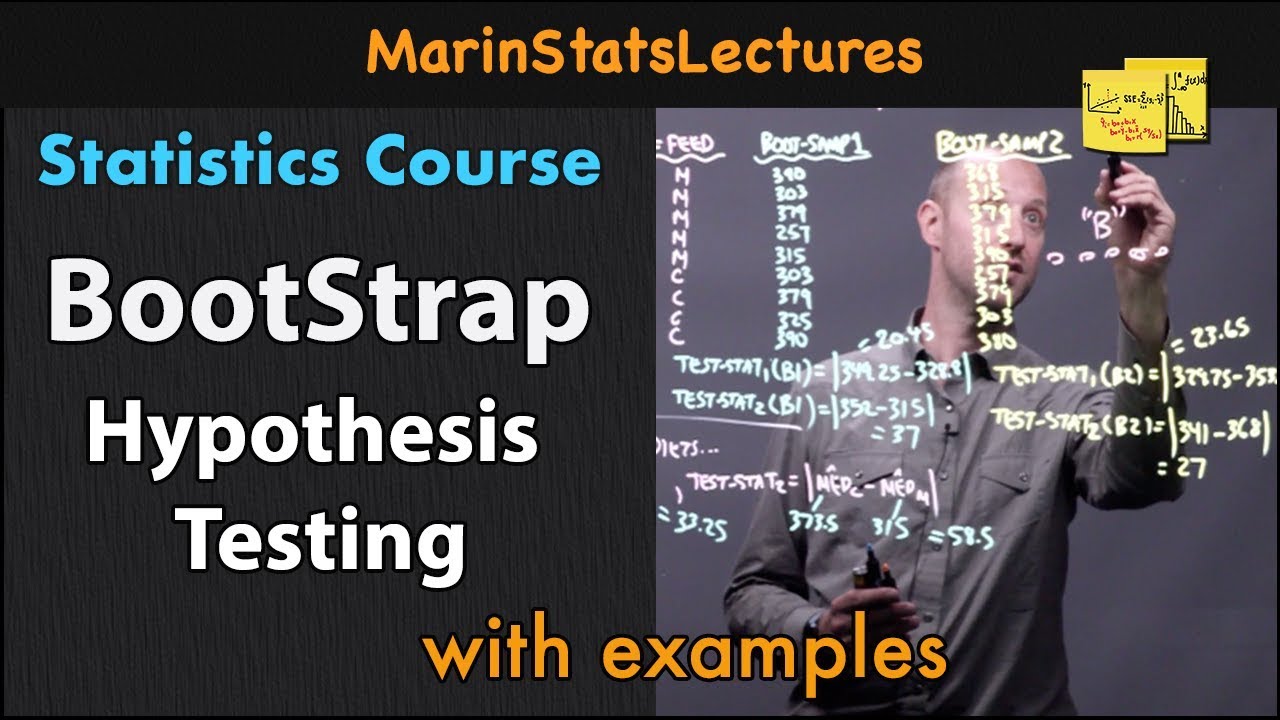
Bootstrap Hypothesis Testing in Statistics with Example |Statistics Tutorial #35 |MarinStatsLectures

p-values: What they are and how to interpret them
5.0 / 5 (0 votes)
Thanks for rating: