Confidence Intervals: Crash Course Statistics #20
TLDRThis video explains confidence intervals, which give a range of reasonable values for a population parameter based on a sample. Confidence intervals represent uncertainty; 95% confidence means the interval contains the true mean 95% of the time if sampling were repeated. Wider intervals are more confident but less precise. Confidence intervals help researchers make decisions and show a tradeoff between accuracy and precision. They provide context for point estimates like polls, demonstrating a range of plausible values.
Takeaways
- 😀 A confidence interval gives a range of reasonable values for a population parameter based on a sample
- 👉🏽 The confidence level (e.g. 95%) refers to the percentage of confidence intervals that contain the true population parameter
- 📊 Confidence intervals reflect the uncertainty in estimating a population parameter from a sample
- 🚀 A wider confidence interval indicates more uncertainty, while a narrower interval indicates more precision
- 📐 The margin of error tells you how far the confidence interval boundaries are from the sample statistic
- 🔎 Confidence intervals help researchers draw conclusions from data and make decisions
- 😕 There's a tradeoff between width of confidence interval and confidence level
- 📟 With small samples sizes, use a t-distribution instead of a normal distribution
- 🗳 Exit polls report margins of error along with polling percentages
- 💃 The pants delivery time estimate of 8am-2pm reflects large uncertainty
Q & A
What is a confidence interval?
-A confidence interval is an estimated range of values, based on observed data, that is likely to include an unknown population parameter. Its center is the sample mean, and it provides a range around this mean to account for uncertainty.
Why are confidence intervals used instead of exact point estimates like the mean?
-Confidence intervals are used because they offer a range that accounts for uncertainty in the estimate of a population parameter, rather than providing a single point estimate which might be misleading due to sample variability.
What does the percentage in a confidence interval, like 95%, represent?
-The percentage in a confidence interval represents the degree of confidence we have that the interval includes the true population parameter. For a 95% confidence interval, we are 95% confident that the interval contains the true mean.
How is the range of a confidence interval determined?
-The range of a confidence interval is determined by the sample mean, the standard deviation, and the distribution of sample means. It includes a range around the sample mean to account for the expected variability in the estimate.
What is the significance of a 95% confidence interval in repeated sampling?
-The significance of a 95% confidence interval in repeated sampling is that if we were to take 100 different samples and calculate a confidence interval for each, about 95 of them would contain the true population mean.
Why might a confidence interval not include the true population mean?
-A confidence interval might not include the true population mean due to the inherent uncertainty and variability in sampling. While it's designed to include the true mean 95% of the time (for a 95% CI), there's a 5% chance it may not.
How can a z-score be used to calculate a confidence interval?
-A z-score, representing the number of standard deviations a data point is from the mean, can be used to find the cutoff points for the middle 95% of the data. This involves finding the 2.5th and 97.5th percentiles to establish the range of the confidence interval.
What role does the standard error play in calculating a confidence interval?
-The standard error, which measures the standard deviation of the sampling distribution of a statistic, is used along with the z-score to convert the range of the confidence interval back into the units of the data being measured.
Why might researchers use a t-distribution instead of a z-distribution for small sample sizes?
-For small sample sizes, the distribution of sample means isn't exactly normal, so the t-distribution, which adjusts its shape based on the amount of data and has thicker tails for small samples, is used to more accurately reflect the increased uncertainty.
How does the choice between a 95% and a 99% confidence interval affect the width of the interval?
-Choosing a higher confidence level, like 99% instead of 95%, results in a wider interval. This is because a higher confidence level requires a broader range to ensure that the true population parameter is included, reflecting a trade-off between precision and confidence.
Outlines
😀 Introducing Confidence Intervals
This paragraph introduces the concept of confidence intervals. It explains how confidence intervals provide a range of reasonable values for a population parameter based on a sample. Examples are given such as delivery times, election polls, and cavities per person.
😃 Using Confidence Intervals to Make Decisions
This paragraph discusses how confidence intervals can be used in decision making. An example is given of a gummy worm factory using confidence intervals to decide whether to repair their bagging machines. Guidelines for sample sizes are also discussed.
😊 Confidence Intervals in Drug Research and Election Polls
This paragraph examines confidence intervals in drug research and election polls. An example of testing a drug to reduce colorblindness is used to demonstrate calculating a confidence interval. Margins of error in election polls are also discussed.
Mindmap
Keywords
💡Confidence Interval
💡Margin of Error
💡Sample Mean
💡Standard Error
💡z-score
💡t-distribution
💡Sampling Distribution
💡Tradeoff
💡Exit polls
💡Accuracy vs Precision
Highlights
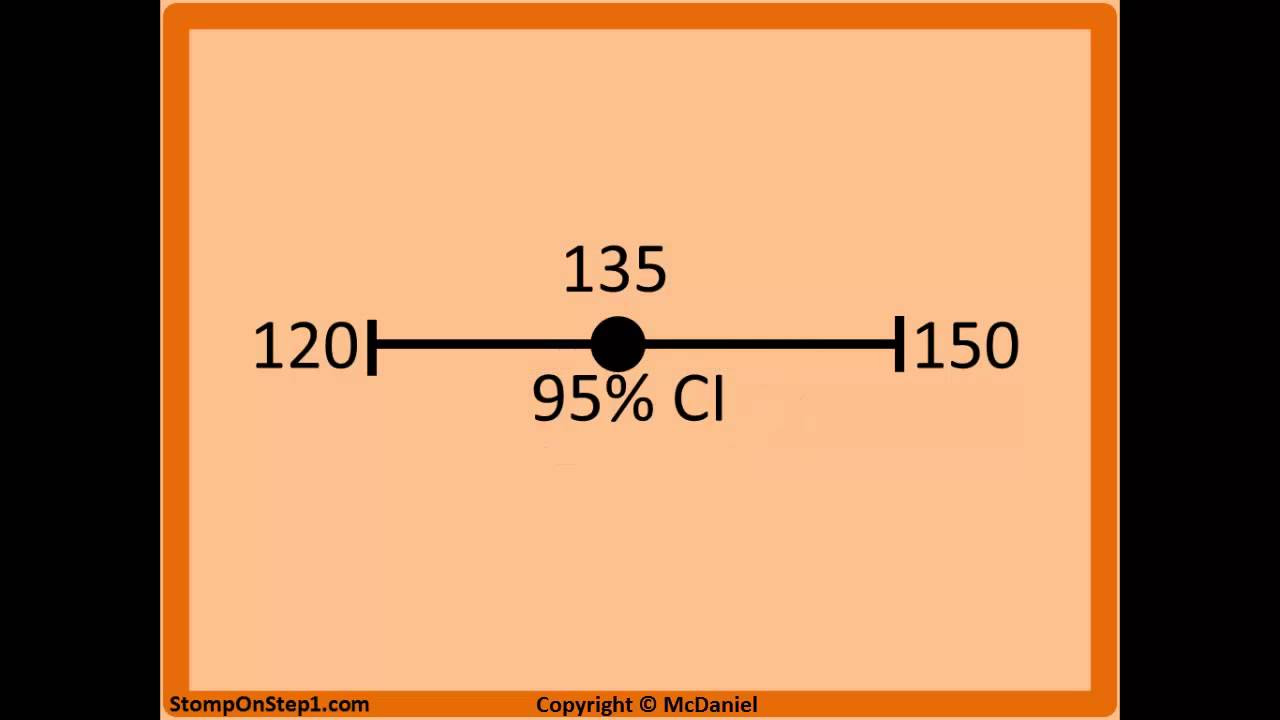
A “confidence interval” is an estimated range of values that seem reasonable based on what we’ve observed.
The 95% in a 95% confidence interval tells us that if we calculated a confidence interval from 100 different samples, about 95 of them would contain the true population mean.
With small sample sizes, the distribution of sample means isn’t always exactly normal, so we often use a t-distribution instead of a z-distribution to find where the middle 95% of our data is.
The t-distribution changes its shape according to how much information there is. With small sample sizes there’s less information so the t-distribution has thicker tails.
When estimating population proportions, the general rule is that your sample size needs to be big enough so that on average, you’d expect to get at least 10 in each group.
If a drug claimed to reduce the proportion of colorblind males born to mothers who took it, we could take a sample to see if the proportion of colorblindness is different from the baseline.
Based on the confidence interval calculated, we don’t have any evidence to conclude whether this medicine is effective or not.
The margin of error reflects the uncertainty that surrounds sample estimates of parameters like the mean or a proportion.
Values inside the margin of error or confidence interval can be thought of as reasonable estimates of the true population parameter.
A 100% confidence interval will always contain the true population mean, but it’s useless. We have to sacrifice a little accuracy for more precision.
A 99% confidence interval will give us a more useful range, but now it’s possible it won’t contain the true mean.
Confidence intervals demonstrate the delicate balancing act of information vs. accuracy.
Confidence intervals quantify our uncertainty.
Confidence intervals demonstrate the tradeoff between accuracy and precision.
They help us understand how to find the sweet spot of information vs. accuracy.
Transcripts
Browse More Related Video
Confidence Interval [Simply explained]
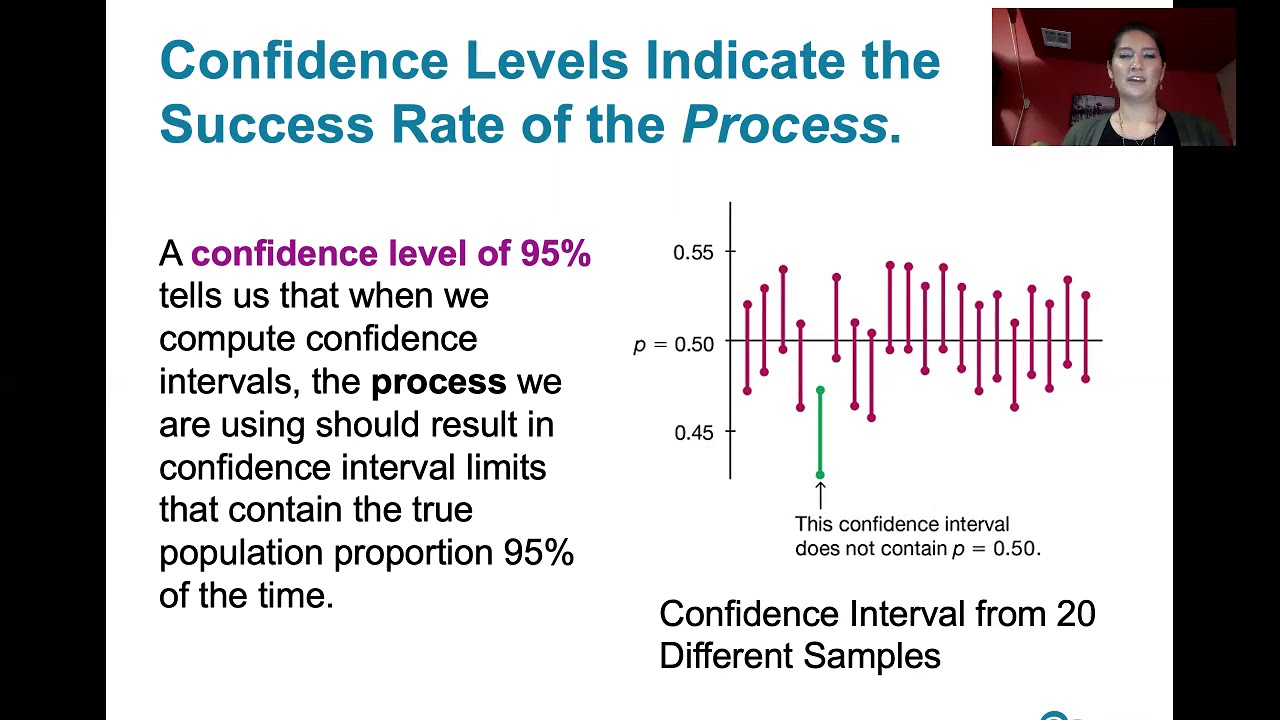
7.1.2 Estimating a Population Proportion - Why We Need Confidence Intervals, How to Interpret Them
Hypothesis Test vs. Confidence Interval | Statistics Tutorial #15 | MarinStatsLectures
Confidence Intervals, Clearly Explained!!!
Understanding Confidence Intervals: Statistics Help
Confidence Interval Interpretation. 95% Confidence Interval 90% 99%
5.0 / 5 (0 votes)
Thanks for rating: