Hypothesis Testing: Calculations and Interpretations| Statistics Tutorial #13 | MarinStatsLectures
TLDRThis video delves into the one-sample t-test, a statistical method to determine if a sample mean is significantly different from a known population mean. It explains the concept of null and alternative hypotheses, the calculation of the test statistic, and the interpretation of p-values. The video emphasizes the importance of distinguishing between statistical significance and clinical or scientific significance, and sets the stage for further discussions on hypothesis testing, errors, and statistical power.
Takeaways
- 📊 The video discusses a hypothesis test for the mean, specifically the one-sample t-test, using a BMI example from 2008 to 2018.
- 🧪 The hypothesis test compares the sample mean to a hypothesized population mean to determine if there's a significant difference.
- 🥼 A random sample of 25 individuals in 2018 showed a mean BMI of 27.8 with a standard deviation of 6, which is higher than the 2008 mean of 25.3.
- 🎯 The null hypothesis (H0) assumes no change in the population mean BMI from 2008, while the alternative hypothesis (Ha) suggests an increase.
- 📈 The test statistic is calculated by comparing the sample mean to the hypothesized mean in terms of standard errors, resulting in a value of 2.08 in this case.
- 📚 To perform the test, assumptions include a simple random sample, independence of observations, and approximate normal distribution of the sample.
- 🎲 The p-value represents the probability of obtaining a sample mean like the observed if the null hypothesis is true, which was 1.9% or 2.4% using Z or t-distribution respectively.
- 🔍 A small p-value (<5%) typically leads to the rejection of the null hypothesis, suggesting evidence in favor of the alternative hypothesis.
- 🚫 Failing to reject the null hypothesis is not the same as proving it true; it means the evidence is not strong enough to conclude a change.
- 🔢 The concept of effect size is introduced to assess the meaningfulness of the observed difference beyond statistical significance.
- 📝 Confidence intervals are used to estimate the range within which the true mean is likely to fall, providing further context for the observed results.
Q & A
What is the main topic of the video?
-The main topic of the video is the one-sample t-test, which is a hypothesis test for the mean used to determine if there has been a significant change in a population parameter, such as BMI, over time.
What was the known mean BMI in the United States in 2008?
-The known mean BMI in the United States in 2008 was 25.3.
What sample size was used in the 2018 study mentioned in the video?
-A random sample of 25 individuals was used in the 2018 study.
What were the sample mean and standard deviation found in the 2018 study?
-The sample mean found in the 2018 study was 27.8, and the sample standard deviation was 6.
What are the null hypothesis (H0) and alternative hypothesis (Ha) for this study?
-The null hypothesis (H0) is that the population mean in 2018 hasn't changed and is still 25.3. The alternative hypothesis (Ha) is that the mean in 2018 is larger than what it was in the past, indicating an increase.
Why do we start hypothesis testing by assuming the null hypothesis to be true?
-We start by assuming the null hypothesis to be true to establish a baseline of what we would expect to see in our sample if there has been no change. This allows us to compare the observed sample data with the expected values under the null hypothesis to test for significant differences.
What is the test statistic calculated in the video, and what does it represent?
-The test statistic calculated in the video is 2.08. It represents how many standard errors the sample mean of 27.8 is away from the hypothesized value of 25.3 under the assumption that the null hypothesis is true.
What is the p-value in this hypothesis test, and what does it indicate?
-The p-value indicates the probability of obtaining a sample mean like the one observed (27.8) or more extreme if the null hypothesis is true. In this case, the p-value is approximately 1.9% or 2.4%, suggesting that such an outcome is unlikely under the null hypothesis.
What is the conclusion drawn from the hypothesis test in the video?
-The conclusion is that because the p-value (1.9% or 2.4%) is small, less than the alpha level (usually 5%), we reject the null hypothesis. This provides evidence to believe that the alternative hypothesis is true, indicating that the mean BMI has increased significantly from 2008 to 2018.
What is the difference between statistical significance and clinical or scientific significance?
-Statistical significance refers to a difference that is unlikely to have occurred by chance, while clinical or scientific significance refers to a difference that is meaningful or important in a real-world context. A small effect size can be statistically significant but not necessarily clinically meaningful.
How is the confidence interval used in this context?
-The confidence interval is used to estimate the range within which the true population mean is likely to fall. In this case, a 95% confidence interval from 25.4 to 30.2 is calculated, providing evidence that the true mean BMI in 2018 is higher than in 2008, but also allowing us to assess whether the increase is clinically meaningful.
What are the assumptions made when conducting a one-sample t-test?
-The assumptions include that the sample is randomly selected, the observations are independent, and the population is approximately normally distributed, or the sample size is large enough for the Central Limit Theorem to apply.
Outlines
🧐 Introduction to Hypothesis Testing: One Sample T-Test
This paragraph introduces the concept of hypothesis testing, specifically focusing on the one sample t-test. It explains the purpose of hypothesis testing and how it is used to determine if there is a significant difference between a sample mean and a known population mean. The example used is the mean BMI in the United States, comparing the mean from 2008 to a sample mean from 2018. The paragraph outlines the process of setting up a null hypothesis (H0) and an alternative hypothesis (Ha), and emphasizes the importance of starting with the assumption that the null hypothesis is true until evidence suggests otherwise.
📊 Calculating the Test Statistic and Interpreting Results
In this paragraph, the process of calculating the test statistic for the one sample t-test is explained. It details how to standardize the sample mean and compare it to the hypothesized population mean in terms of standard error. The paragraph also discusses the assumptions required for the test, such as having a simple random sample and approximately normally distributed data. The concept of p-value is introduced, explaining its role in determining the likelihood of observing the sample mean if the null hypothesis is true. The paragraph concludes by discussing the implications of the p-value in relation to the test statistic and the decision to reject or fail to reject the null hypothesis.
🤔 Understanding the Implications of the Test Results
This paragraph delves into the interpretation of the test results, specifically the p-value, and its implications for the null and alternative hypotheses. It explains the concept of statistical significance versus clinical or scientific significance, emphasizing the importance of not just finding a statistically significant result but also assessing whether the observed effect size is meaningful. The paragraph also introduces the concept of confidence intervals as a tool for estimating the true population mean and determining the magnitude of the observed change. The discussion concludes with a reminder that statistical significance does not necessarily equate to clinical or practical importance.
🔍 Reflecting on Hypothesis Testing and Future Topics
The final paragraph summarizes the foundational aspects of hypothesis testing covered in the video, highlighting the importance of understanding the null and alternative hypotheses, the test statistic, and the p-value. It acknowledges that while a one sample t-test may not always be the most practical scientific application, it serves as a basis for understanding hypothesis testing in general. The paragraph also teases upcoming topics, such as the types of errors that can be made in hypothesis testing and the concept of statistical power, encouraging viewers to stay tuned for more informative content.
Mindmap
Keywords
💡Hypothesis Test
💡One-Sample T-Test
💡Null Hypothesis (H0)
💡Alternative Hypothesis (Ha)
💡Sample Mean
💡Sample Standard Deviation
💡Test Statistic
💡P-Value
💡Effect Size
💡Confidence Interval
💡Statistical Significance
Highlights
The video discusses a hypothesis test for the mean, specifically the one-sample t-test.
The foundation of hypothesis testing is explained, with a focus on using software rather than manual calculations.
The example used is the mean BMI in the United States, with historical data from 2008 and a sample from 2018.
A sample of 25 individuals was taken in 2018 with a mean BMI of 27.8, prompting the question of significance.
Null and alternative hypotheses are introduced, with the null hypothesis assuming no change in the population mean BMI.
The concept of standardizing the test statistic is discussed, with the calculation of a 2.08 standard error.
Assumptions for the t-test include a simple random sample, independent observations, and approximate normal distribution.
The t-distribution is used to find the p-value, which in this case is approximately 1.9% or 2.4%.
The p-value indicates the probability of obtaining the sample mean or higher if the null hypothesis is true.
A small p-value suggests evidence against the null hypothesis, leading to its rejection.
The decision to reject the null hypothesis is based on the p-value being smaller than a predetermined alpha level.
The alpha level is a guideline, typically set at 5%, but its interpretation and application are nuanced.
Statistical significance is differentiated from clinical or scientific significance, with the latter focusing on the meaningfulness of the change.
A 95% confidence interval for the mean BMI in 2018 is calculated, providing evidence of a significant increase.
The video emphasizes understanding the concepts behind hypothesis testing rather than just the calculations.
The one-sample t-test is foundational for understanding hypothesis testing in general.
The video concludes by mentioning future discussions on errors in hypothesis testing and the concept of power.
Transcripts
Browse More Related Video

Explaining The One-Sample t-Test
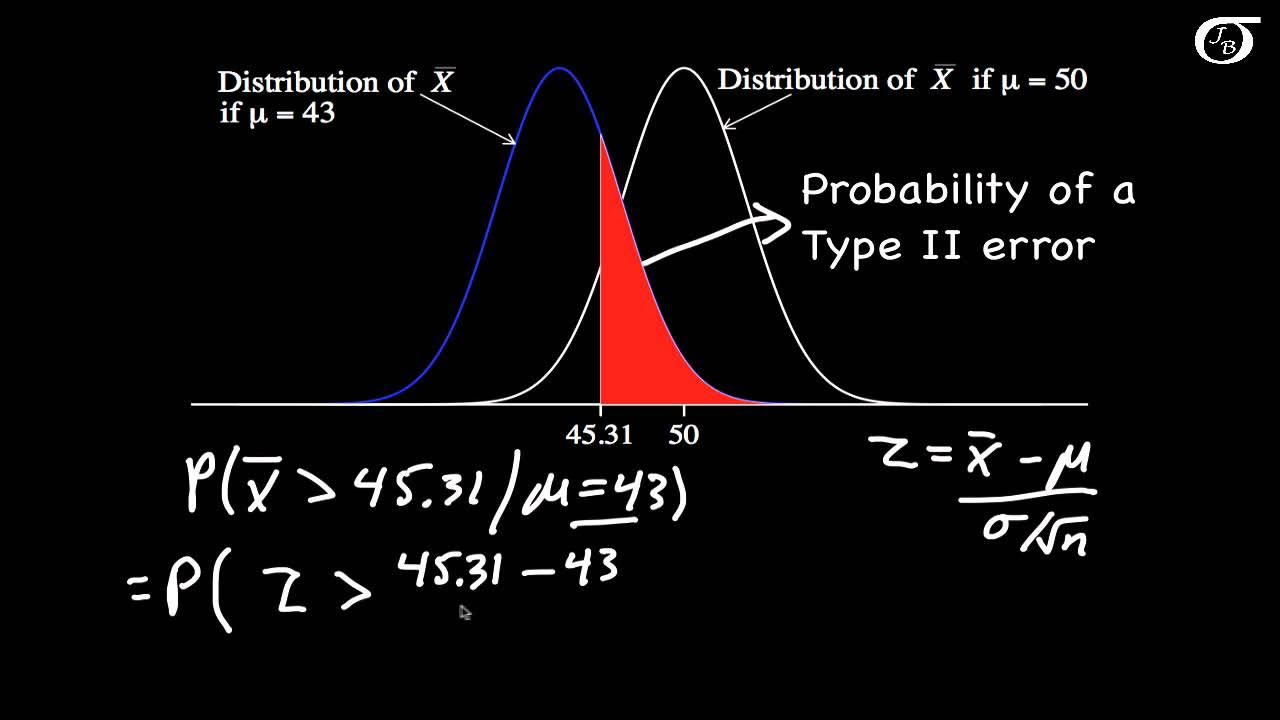
Calculating Power and the Probability of a Type II Error (A One-Tailed Example)
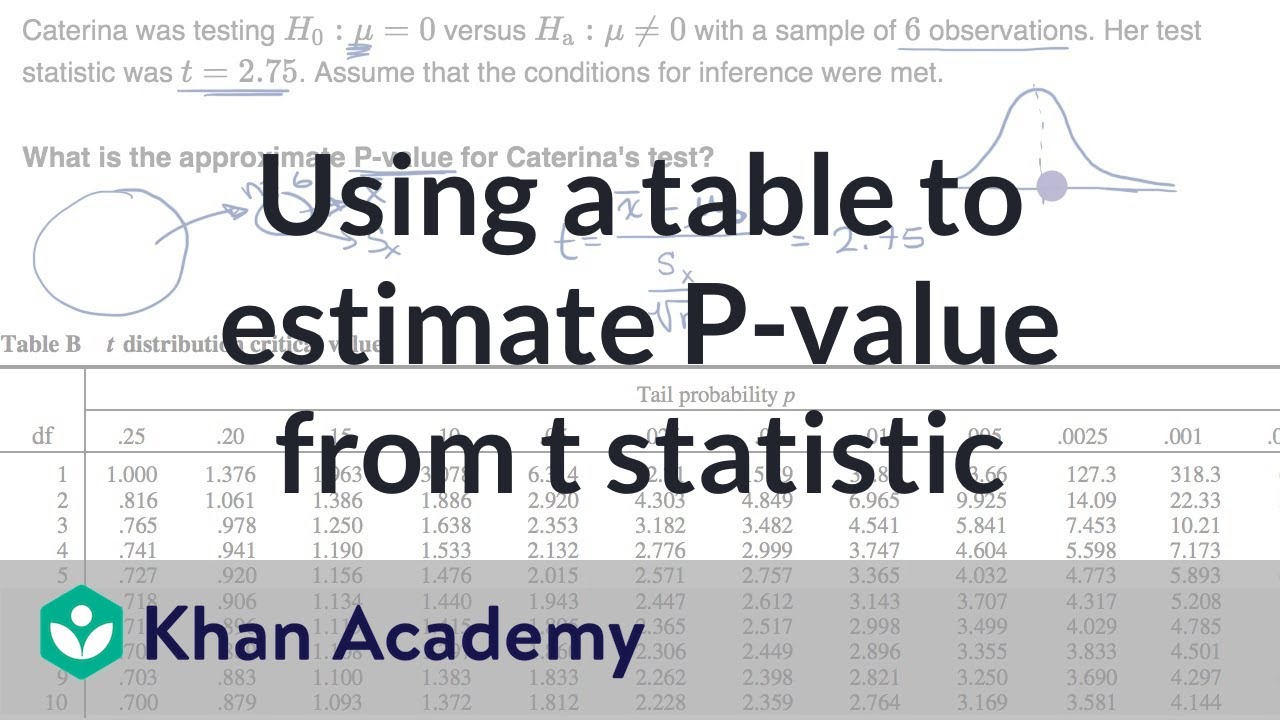
Using a table to estimate P-value from t statistic | AP Statistics | Khan Academy
Null Hypothesis, p-Value, Statistical Significance, Type 1 Error and Type 2 Error

What is a Hypothesis Test and a P-Value? | Puppet Master of Statistics

AP Statistics Unit 6 Summary Review Inference for Proportions Part 2 Significance Tests
5.0 / 5 (0 votes)
Thanks for rating: