Explaining The One-Sample t-Test
TLDRThis training video introduces the one-sample T Test, a statistical method for making data-driven decisions about a single population. It covers the concept of hypothesis testing, the null hypothesis significance testing framework, and the process of rejecting or failing to reject the null hypothesis based on the P value. The video uses the example of YouTube watch time to demonstrate the T Test, explaining how to calculate the sample mean, variance, and T statistic, and how the T distribution with degrees of freedom is used to determine statistical significance.
Takeaways
- 😀 The video is an employee training session on the one sample T Test, a statistical method for making data-driven decisions.
- 🔍 The presenter, Christian, is a PhD student in Biostatistics aiming to simplify statistics for better career and daily life application.
- 📚 The video covers the concept of a 'population' in statistics, which is a group with similar qualities of interest for study.
- 🔬 It introduces the idea of 'statistical inference', using a sample to make inferences about a larger population.
- 📈 The 'null hypothesis significance testing framework' (NHST) is the primary method discussed for hypothesis testing.
- 🧐 The 'null hypothesis' (H0) is a statement about a population parameter that the researcher wants to test and potentially disprove.
- 📊 A 'test statistic' is a number derived from sample data to evaluate the null hypothesis against its expected distribution.
- 📉 The 'T statistic' is used in the one sample T Test, which follows a T distribution when the sample size is large enough.
- 📝 The 'sample mean' and 'sample variance' are calculated from the data and used to construct the T statistic.
- 🤔 The 'P value' is a critical component of NHST, representing the probability of observing the test statistic under the null hypothesis, and is used to judge the significance of the results.
- 📉 The video uses an example of YouTube watch time to demonstrate the process of conducting a one sample T Test and interpreting the results.
Q & A
What is the main purpose of the one sample T Test?
-The one sample T Test is used to make data-driven decisions by testing a hypothesis about the population mean based on a sample. It helps to determine if the sample data is significantly different from the hypothesized population mean.
What is the difference between a population and a sample in statistics?
-A population in statistics refers to the entire group of items with similar qualities that we are interested in studying. A sample is a smaller subset of the population from which data is collected for analysis.
What is the concept of statistical inference in the context of populations and samples?
-Statistical inference is the process of making inferences about the population based on the data collected from a sample. It allows us to estimate population characteristics from sample data.
What is the null hypothesis significance testing (NHST) framework?
-The NHST framework is a method used in statistics to test hypotheses about population parameters. It involves assuming a null hypothesis, collecting data, calculating a test statistic, and determining the likelihood of the test statistic under the null hypothesis using a P value.
Why is the null hypothesis important in hypothesis testing?
-The null hypothesis represents the status quo or a default assumption about the population. It is important because it sets a benchmark against which the alternative hypothesis is compared. The goal is to disprove the null hypothesis if the data suggests it is unlikely to be true.
What is a test statistic and how is it used in the one sample T Test?
-A test statistic is a single number that summarizes the data in a way that is relevant to the hypothesis being tested. In the one sample T Test, the test statistic is a standardized version of the sample mean, which is compared to a T distribution under the null hypothesis.
What is the role of the P value in hypothesis testing?
-The P value is the probability of observing a test statistic as extreme as, or more extreme than, the one calculated from the sample data, assuming the null hypothesis is true. A small P value suggests that the observed data is unlikely under the null hypothesis, leading to its rejection.
Why is the sample variance used instead of the population variance in the one sample T Test?
-The sample variance is used because the population variance is typically unknown. By using the sample variance, we can calculate the test statistic from data that is available to us, making the test feasible to perform.
What is the significance of the T distribution in the one sample T Test?
-The T distribution is used as the null distribution for the test statistic in the one sample T Test. It is similar to a normal distribution but has heavier tails, accounting for the extra uncertainty introduced by estimating the population variance from the sample.
How does the shape of the T distribution change with the sample size?
-As the sample size increases, the T distribution becomes more like a standard normal distribution. The 'fat tails' become less pronounced, indicating that outliers are less likely as the sample size grows.
What is the difference between rejecting and failing to reject the null hypothesis?
-Rejecting the null hypothesis means that the data provides enough evidence to conclude that the null hypothesis is unlikely to be true. Failing to reject the null hypothesis means that the data does not provide enough evidence to overturn it, not implying that the null hypothesis is true, but rather that the test was inconclusive.
Outlines
📚 Introduction to One Sample T-Test and Statistical Inference
This paragraph introduces the concept of the one sample T-Test within the context of statistical inference. It explains the importance of understanding populations and samples in statistics and the role of hypothesis testing in making data-driven decisions. The speaker, Christian, a PhD student in Biostatistics, sets the stage for the video by outlining the main concepts to be discussed, including the definition of a population, the use of samples to infer population characteristics, and the foundational ideas behind hypothesis testing. The paragraph emphasizes the significance of hypothesis testing in guiding decisions with data rather than relying on intuition or opinions.
🔍 Null Hypothesis Significance Testing (NHST) Framework
The second paragraph delves into the NHST framework, a method for hypothesis testing developed by Sir Ronald Fisher. It explains the concept of the null hypothesis (H0) as a statement about the population that assumes a status quo. The paragraph outlines the process of hypothesis testing, which involves collecting data to form a test statistic, comparing this statistic to the null distribution, and determining the likelihood of the observed results under the null hypothesis. The introduction of the P-value as a measure of the probability of observing the test statistic or an even more extreme result if the null hypothesis were true is also discussed. The paragraph uses the example of YouTube watch time to illustrate the application of NHST in a real-world scenario.
📈 Understanding the One Sample T-Test and T-Distribution
This paragraph focuses on the specifics of the one sample T-Test, a hypothesis test used to determine if a sample mean is significantly different from a known population mean. It discusses the limitations of the Z-test and introduces the T-distribution, which accounts for the unknown population variance by using the sample variance. The T-distribution is characterized by its heavier tails, indicating a higher likelihood of outliers compared to a normal distribution. The paragraph explains how the T-distribution changes with sample size, becoming more normal as the sample size increases. It also covers the concept of degrees of freedom in the context of the T-distribution and demonstrates how to perform a one sample T-Test using sample data, including calculating the sample mean, variance, and T-statistic, and interpreting the resulting P-value.
📊 Conclusion: Significance of Hypothesis Testing in Data Analysis
The final paragraph wraps up the video by summarizing the key points discussed. It reiterates the importance of hypothesis testing, particularly the one sample T-Test, in analyzing data and making informed decisions. The paragraph clarifies that under NHST, researchers can only reject or fail to reject the null hypothesis based on the P-value, and that statistical significance is achieved when the P-value is below a certain threshold, typically 0.05. It also touches on the extension of NHST to include alternative hypotheses and confidence intervals, which will be covered in more detail in future videos. The paragraph concludes with an encouragement for employees to deepen their understanding of these concepts and a reminder to sign up for the employee newsletter.
Mindmap
Keywords
💡One Sample T Test
💡Population
💡Sample
💡Statistical Inference
💡Hypothesis Test
💡Null Hypothesis (H0)
💡Test Statistic
💡Null Distribution
💡P Value
💡Student's T Distribution
💡Degrees of Freedom
Highlights
Introduction to the one sample T Test and its importance in making data-driven decisions.
Explanation of the concept of a population in statistics and its relevance to research.
The significance of samples in representing populations and the role of statistical inference.
Definition and importance of the population mean as a key parameter in statistical analysis.
Introduction to the null hypothesis significance testing (NHST) framework.
The concept of the null hypothesis (H0) and its role in hypothesis testing.
The process of using a test statistic to evaluate the likelihood of the null hypothesis.
Understanding the null distribution and its importance in hypothesis testing.
The role of the sample mean as an estimator for the population mean in the one sample T Test.
The central limit theorem and its implications for the sampling distribution of the sample mean.
The problem with the Z test and the introduction of the T distribution to address it.
Explanation of the T distribution, its properties, and how it differs from a normal distribution.
The concept of degrees of freedom in the context of the T distribution.
A practical example of conducting a one sample T Test using YouTube watch time data.
Calculation of the sample mean and variance as part of the T Test process.
Interpretation of the P value in the context of hypothesis testing and decision-making.
The significance of statistical significance and the role of the 0.05 P value threshold.
Differentiating between rejecting and failing to reject the null hypothesis in NHST.
The limitations of hypothesis tests and the importance of proper understanding and application.
Conclusion summarizing the key components and process of the one sample T Test and NHST.
Transcripts
Browse More Related Video
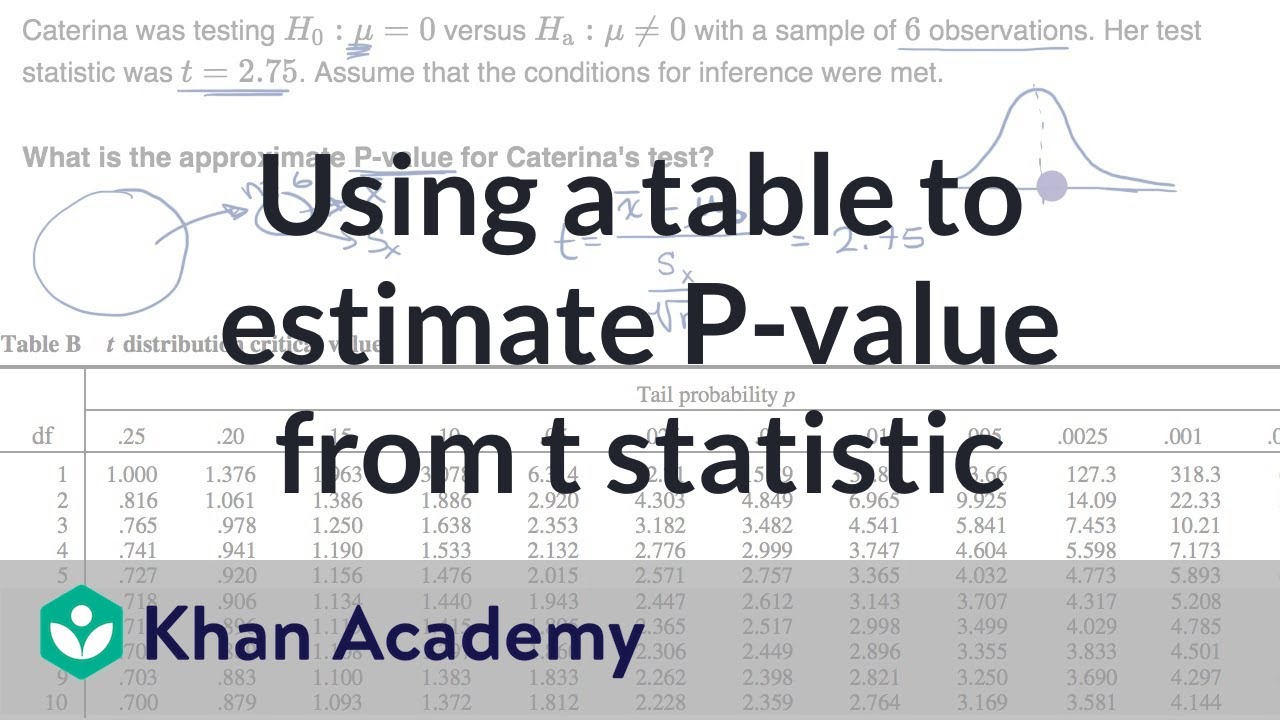
Using a table to estimate P-value from t statistic | AP Statistics | Khan Academy
Hypothesis Testing: Calculations and Interpretations| Statistics Tutorial #13 | MarinStatsLectures
Test Statistic For Means and Population Proportions
10.1.5 Correlation - Testing a Claim of Correlation Using the P-Value Method
Two-Sample t Test in R (Independent Groups) with Example | R Tutorial 4.2 | MarinStatsLectures
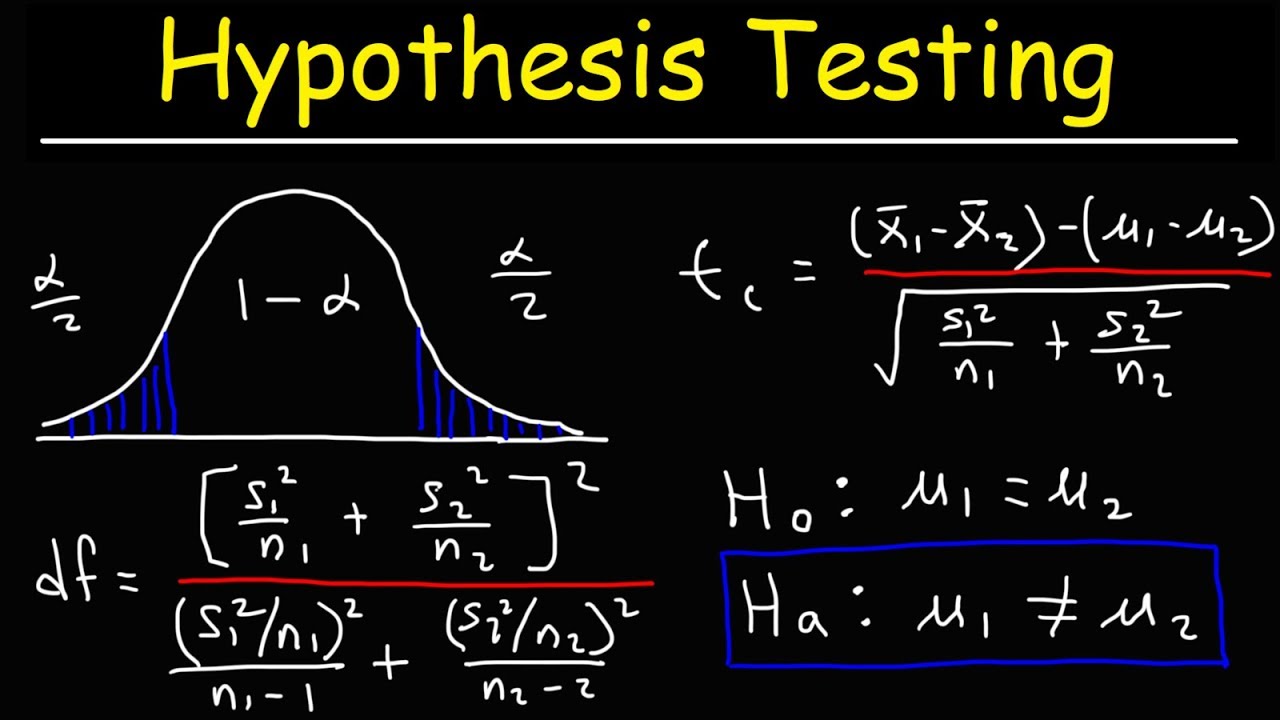
Hypothesis Testing - Difference of Two Means - Student's -Distribution & Normal Distribution
5.0 / 5 (0 votes)
Thanks for rating: