Using a table to estimate P-value from t statistic | AP Statistics | Khan Academy
TLDRThe video script discusses a statistical hypothesis testing scenario where Caterina is testing a null hypothesis that the population mean is equal to zero against an alternative hypothesis that it is not. With a sample size of six, she calculates a T statistic of 2.75. The script explains the process of finding the P-value by considering the T distribution, degrees of freedom (sample size minus one), and looking up critical values in a T table. It emphasizes that the P-value is the sum of the probabilities of getting a T value at least 2.75 above or below the mean, which is approximately 0.04 in this case. The final step is to compare this P-value to the significance level set by Caterina to decide whether to reject or not reject the null hypothesis.
Takeaways
- 🔍 Caterina's null hypothesis is that the true population mean of a dataset is equal to zero, while her alternative hypothesis is that it's not equal to zero.
- 📐 She takes a sample of six observations to test her null hypothesis and calculates a test statistic (T value) of 2.75.
- ✅ The conditions for statistical inference are assumed to be met, allowing for the calculation of the P-value.
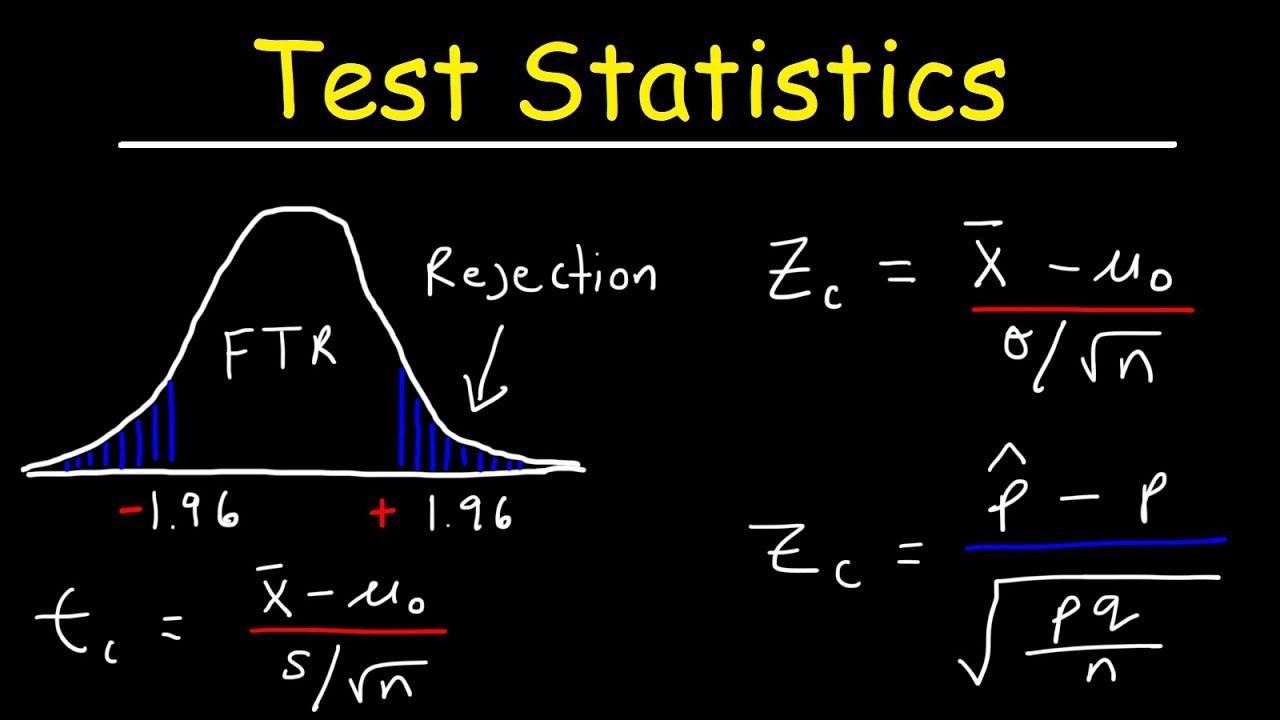
- 🧮 The T value is calculated by dividing the difference between the sample mean and the assumed population mean (from the null hypothesis) by the estimated standard deviation of the sampling distribution.
- 📊 The estimated standard deviation is the sample standard deviation divided by the square root of the sample size (N).
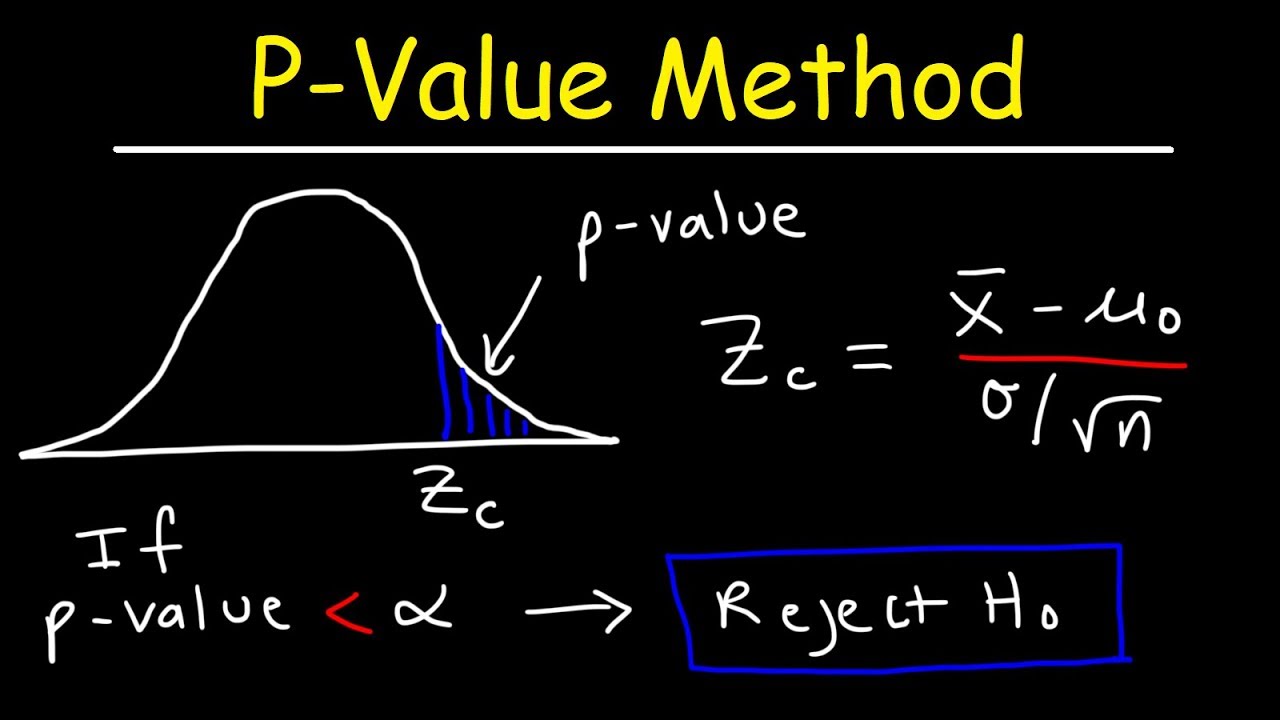
- 📉 To find the P-value, Caterina considers the probability of getting a T value that is 2.75 or more above or below the mean, due to a two-tailed test.
- 📚 A T-table is used to find the critical values and corresponding tail probabilities, which are based on degrees of freedom (sample size minus one).
- 🔢 For a sample size of six, the degrees of freedom are five, and the T-table is used to find the probability associated with a T value of 2.75.
- 🔑 The tail probability from the T-table for the T value of 2.75 is between 0.025 and 0.02, with a closer approximation to 0.02.
- 🧮 The P-value for Caterina's test is approximately the sum of the two tail probabilities, which is about 0.04.
- ✅ Caterina compares the P-value to her predetermined significance level to decide whether to reject the null hypothesis in favor of the alternative.
Q & A
What is Caterina's null hypothesis in the test?
-Caterina's null hypothesis is that the true population mean of the data set is equal to zero.
What is the alternative hypothesis to Caterina's null hypothesis?
-The alternative hypothesis is that the true population mean is not equal to zero.
What sample size did Caterina use for her test?
-Caterina used a sample size of six observations for her test.
What is the test statistic (T value) that Caterina obtained from her sample?
-The test statistic (T value) obtained from Caterina's sample is 2.75.
What is the formula for calculating the T value in Caterina's test?
-The T value is calculated as the difference between the sample mean and the assumed population mean (from the null hypothesis), divided by the estimated standard deviation of the sampling distribution, which is the sample standard deviation divided by the square root of the sample size (N).
What are the degrees of freedom in Caterina's test?
-The degrees of freedom in Caterina's test are the sample size minus one, which in this case is 6 - 1 = 5.
How does the T distribution differ from the Z distribution?
-The T distribution differs from the Z distribution in that it accounts for smaller sample sizes and is used when the population standard deviation is unknown. It also has different critical values and is more spread out than the Z distribution.
What does Caterina need to look up in the T table to find the P-value?
-Caterina needs to look up the T value of 2.75 in the T table corresponding to the degrees of freedom, which is 5 in this case.
What is the approximate P-value for Caterina's test, according to the T table?
-The approximate P-value for Caterina's test is the sum of the probabilities in the two tails of the T distribution that are at least 2.75 units away from the mean, which is approximately 0.04.
What does Caterina do with the P-value in relation to her significance level?
-Caterina compares the P-value to her predetermined significance level. If the P-value is lower than the significance level, she rejects the null hypothesis and accepts the alternative hypothesis. If the P-value is not lower, she does not reject the null hypothesis.
What does it mean if Caterina rejects the null hypothesis?
-If Caterina rejects the null hypothesis, it suggests that there is sufficient evidence to support the alternative hypothesis, meaning that the true population mean is not equal to zero.
What does it imply if Caterina does not reject the null hypothesis?
-If Caterina does not reject the null hypothesis, it implies that there is not enough evidence to suggest that the true population mean is different from zero, and the results could be due to chance.
Outlines
🔍 Hypothesis Testing with Sample Data
In this paragraph, the instructor introduces Caterina's hypothesis testing scenario. Caterina's null hypothesis posits that the population mean of a certain dataset is zero, while her alternative hypothesis suggests it is not. She takes a sample of six observations and calculates a T statistic of 2.75, assuming the conditions for statistical inference are met. The task at hand is to determine the approximate P-value for Caterina's test. The concept of the T statistic is explained, which is the difference between the sample mean and the assumed population mean from the null hypothesis, divided by the estimated standard error of the sampling distribution. The instructor emphasizes the need to consider both tails of the T distribution when calculating the P-value, which is the probability of observing a T statistic as extreme as 2.75 or more in either direction from the mean. A T table is used to find the critical values and corresponding tail probabilities, which are then summed to estimate the P-value.
Mindmap
Keywords
💡Null Hypothesis
💡Alternative Hypothesis
💡Sample Size
💡Test Statistic
💡P-value
💡Degrees of Freedom
💡T Distribution
💡Sample Mean
💡Sample Standard Deviation
💡Significance Level
💡Rejection of Null Hypothesis
Highlights
Caterina is testing a null hypothesis that the true population mean of a data set is equal to zero.
The alternative hypothesis is that the population mean is not equal to zero.
A sample of six observations is taken to test the null hypothesis.
The test statistic T is calculated to be 2.75 based on the sample.
The conditions for statistical inference are assumed to be met.
The T value is calculated as the difference between the sample mean and the null hypothesis mean (0), divided by the estimated standard error.
The estimated standard error is the sample standard deviation divided by the square root of the sample size (N).
The T distribution is used instead of the Z distribution because we are estimating the population standard deviation.
The degrees of freedom for the T distribution is the sample size minus one (N-1).
For this example, the degrees of freedom is 5 (sample size of 6 minus 1).
The T value of 2.75 is looked up in the T distribution table for the corresponding tail probabilities.
The tail probability for a T value of 2.75 with 5 degrees of freedom is between 0.025 and 0.02.
The T distribution is symmetric, so the tail probabilities on both sides are approximately equal.
The P-value for the test is the sum of the tail probabilities, which is approximately 0.04.
If the P-value is less than the significance level, the null hypothesis is rejected in favor of the alternative hypothesis.
If the P-value is not less than the significance level, the null hypothesis cannot be rejected.
The significance level is predetermined before conducting the hypothesis test.
This example demonstrates the process of hypothesis testing using a T-test for a sample mean.
Transcripts
Browse More Related Video

Explaining The One-Sample t-Test
Test Statistic For Means and Population Proportions

P-values and significance tests | AP Statistics | Khan Academy
P-Value Method For Hypothesis Testing

Finding a P-value given the test statistic

P Value and Hypothesis Testing Simplified|P-value and Hypothesis testing concepts in Statistics
5.0 / 5 (0 votes)
Thanks for rating: