AP Statistics Unit 6 Summary Review Inference for Proportions Part 2 Significance Tests
TLDRThis video script offers a comprehensive guide to conducting a one-sample Z test for population proportions, focusing on the inference for categorical data. It explains the concept of hypothesis testing, the creation of null and alternative hypotheses, and the process of building a sampling distribution. The script walks through examples to illustrate how to calculate test statistics and P-values, make conclusions based on significance levels, and understand the potential errors and power of tests. It emphasizes the importance of sample size, significance level, and the actual difference from the null hypothesis in determining the test's power.
Takeaways
- 📊 Inference is the process of using sample statistics to make judgments about a population parameter.
- 🧐 A significance test, also known as a hypothesis test, is used to determine if a claim about a population proportion is true or not.
- 🔍 The process begins with a claim and involves creating hypotheses: the null hypothesis (no change from the original thought) and the alternative hypothesis (the new believed truth).
- 📚 The one-sample Z test for a population proportion is used when checking a claim based on a single sample from the population.
- 🌐 Three types of alternative hypotheses can be formed: greater than, less than, or not equal to the population proportion stated in the null hypothesis.
- 📐 To build a sampling distribution for the sample proportion, you need the mean (assume null hypothesis is true), standard deviation, and a normal model.
- ✅ The conditions for using a normal model include a random sample, sample size less than 10% of the population, and sufficient sample size with 10 or more successes and failures.
- 📉 The significance level (Alpha) determines how unusual a sample must be to reject the null hypothesis, with common values being 1% or 5%.
- 📊 The Z-score (test statistic) indicates how many standard deviations an observed sample proportion is from the mean under the null hypothesis.
- 🔑 The P-value is the probability of observing the sample proportion or a more extreme value, assuming the null hypothesis is true.
- 🔍 The conclusion of the test is based on comparing the P-value to the significance level, leading to either rejecting the null hypothesis or failing to reject it.
Q & A
What is the main focus of Unit 6 in the video?
-Unit 6 focuses on inference for categorical data with an emphasis on proportions.
What is inference in statistics?
-Inference in statistics involves using information from a sample, known as statistics, to make judgments about a population parameter.
What is a significance test also known as?
-A significance test is also known as a hypothesis test.
What is the purpose of a significance test?
-The purpose of a significance test is to determine if a claim made about a population proportion is true or not.
What are the two types of hypotheses created from a claim?
-The two types of hypotheses created from a claim are the null hypothesis and the alternative hypothesis.
What is the null hypothesis in the context of a significance test?
-The null hypothesis is the assumption that there has been no change from the original thought about the population proportion, and it is equal to what was initially believed.
What is the alternative hypothesis in the context of a significance test?
-The alternative hypothesis is what we believe to be true now, based on the claim made about the population proportion.
What are the three conditions necessary for a sampling distribution to be normal when working with proportions?
-The three conditions are: the sample must be random, the sample size must be less than 10% of the population, and the sample must have at least 10 or more successes and failures.
What is a Z test for a population proportion?
-A Z test for a population proportion is a statistical procedure used to check a claim about a population proportion based on a single sample taken from that population.
What is the significance level (Alpha) in a significance test?
-The significance level (Alpha) is the threshold used to determine what is considered an unusual or unlikely sample, typically set at 1% or 5%, indicating the top or bottom 1% or 5% of sample proportions.
What is a P-value in the context of a significance test?
-The P-value is the probability of the sample proportion occurring or being more extreme, given that the null hypothesis is true. It helps determine whether the observed sample provides strong enough evidence to reject the null hypothesis.
What are the four steps to conducting a one-sample Z test for a population proportion?
-The four steps are: 1) Naming the test and defining the population proportion, 2) Checking the necessary conditions and building the sampling distribution, 3) Calculating the test statistic (z-score) and the P-value, and 4) Making a conclusion based on the comparison of the P-value to the significance level (Alpha).
What is the difference between a one-sided and a two-sided test?
-A one-sided test is used when the alternative hypothesis is that the population proportion is either greater than or less than the null hypothesis value. A two-sided test is used when the alternative hypothesis is that the population proportion is not equal to the null hypothesis value.
What is meant by 'rejecting the null hypothesis' in a significance test?
-Rejecting the null hypothesis means that there is enough evidence to suggest that the null hypothesis is not true, and therefore, the alternative hypothesis is likely true.
What is a type I error in the context of hypothesis testing?
-A type I error occurs when the null hypothesis is true, but the sample leads to its rejection, resulting in the acceptance of a false alternative hypothesis.
What is a type II error in the context of hypothesis testing?
-A type II error occurs when the null hypothesis is false and the alternative hypothesis is true, but the sample leads to the retention of the null hypothesis, failing to reject it when it should have been rejected.
What is 'power' in the context of hypothesis testing?
-Power in hypothesis testing is the probability of correctly rejecting a false null hypothesis and accepting the alternative hypothesis when it is true.
Outlines
📚 Introduction to Inference for Categorical Data
The script introduces the concept of inference for categorical data, focusing on proportions. Inference involves using sample statistics to make judgments about population parameters. The video aims to explain how to use sample proportions to test claims about population proportions through significance tests, also known as hypothesis tests. The process begins with formulating hypotheses, taking a sample, and then determining if there is strong evidence to support or reject the claim about the population proportion using a one-sample Z test.
🔍 Understanding Hypothesis Testing for Population Proportions
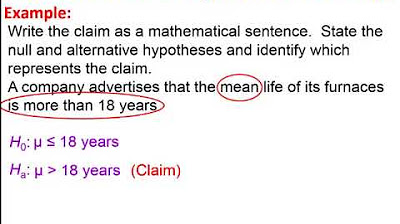
This paragraph delves into the specifics of hypothesis testing for population proportions. It explains the creation of null and alternative hypotheses based on claims about the population. The null hypothesis assumes no change from the initial assumption, while the alternative reflects the claim being tested. The paragraph provides three examples illustrating how hypotheses are formed and the types of claims being investigated, such as less than, greater than, or not equal to a certain proportion. It also introduces the concept of one-sided and two-sided tests depending on the nature of the alternative hypothesis.
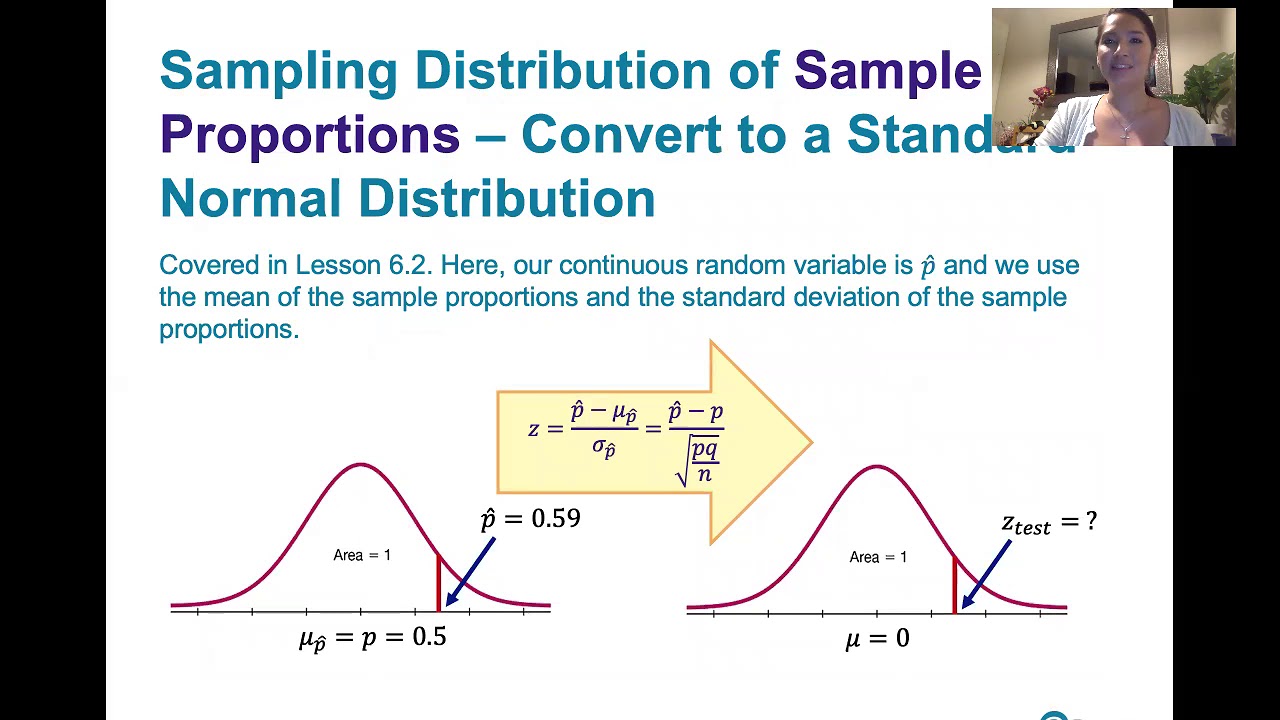
📉 Building a Sampling Distribution for Sample Proportions
The script explains the process of constructing a sampling distribution for sample proportions, assuming the null hypothesis is true. The mean of this distribution is the population proportion from the null hypothesis, and the standard deviation is calculated using the formula involving the square root of the product of the null proportion and its complement, divided by the sample size. The paragraph emphasizes the importance of checking three conditions for the sampling distribution: randomness of the sample, the sample size being less than 10% of the population for independence, and the sample size being large enough to apply the normal model, specifically having 10 or more successes and failures.
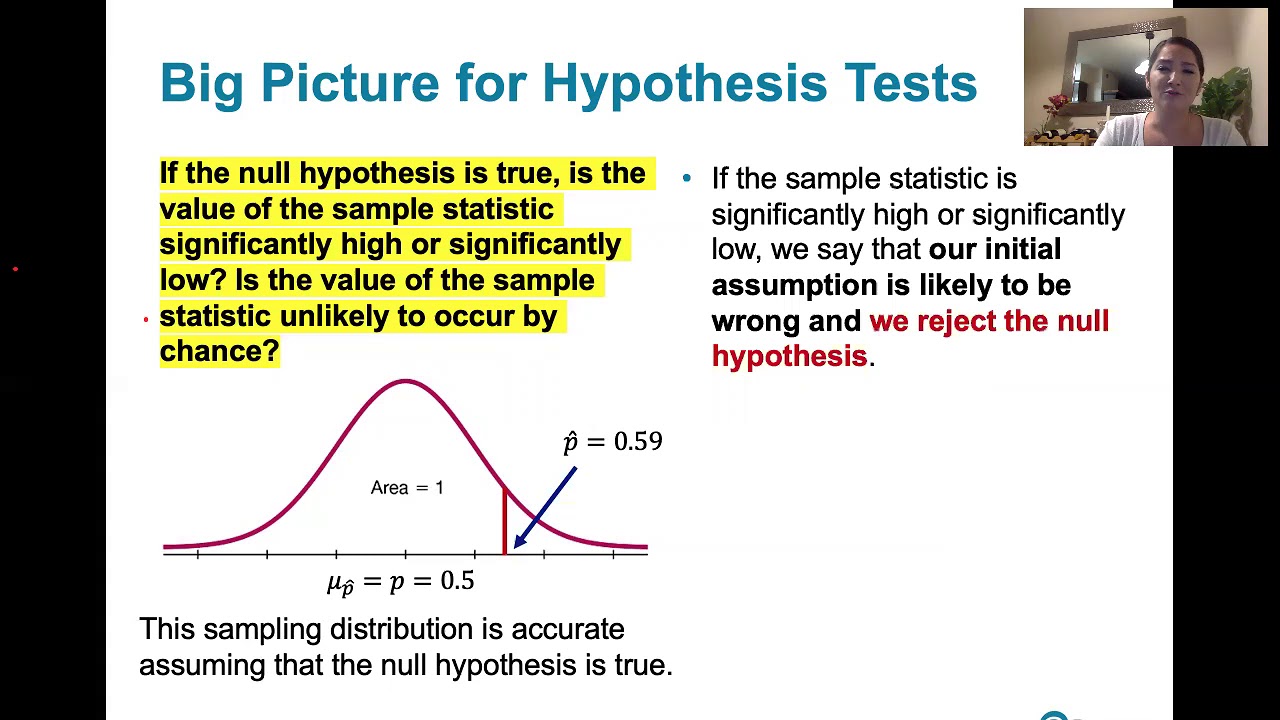
📝 Conducting a One Sample Z Test for Population Proportion
The paragraph outlines the steps to conduct a one sample Z test for a population proportion. It begins with creating hypotheses, then building the sampling distribution based on the null hypothesis. The observed sample proportion is compared to this distribution to determine if it falls within the range of normal variation or if it is unusually high or low. The significance of the sample proportion in relation to the null hypothesis is assessed using a Z-score, which indicates how many standard deviations the sample proportion is from the expected mean under the null hypothesis.
🤔 Interpreting P-Values and Making Conclusions
This section discusses the interpretation of P-values in the context of hypothesis testing. The P-value represents the probability of observing a sample proportion as extreme as, or more extreme than, the one obtained, assuming the null hypothesis is true. If the P-value is lower than the significance level (commonly 1% or 5%), it suggests that the observed sample is unlikely under the null hypothesis, leading to the rejection of the null in favor of the alternative hypothesis. The paragraph also explains the concept of the significance level (Alpha) and how it is used to determine the threshold for rejecting the null hypothesis.
🔄 Examples of Applying the One Sample Z Test
The script provides examples to illustrate the application of the one sample Z test. It walks through the process of testing hypotheses about proportions in different scenarios, such as city officials' beliefs about recycling rates, a math professor's assessment of students' abilities to interpret scatter plots, and a biologist's investigation into the proportion of vertebrate animals in a habitat. Each example demonstrates the calculation of the Z-score and P-value, and the subsequent decision to reject or fail to reject the null hypothesis based on these values.
🚫 Addressing Errors and the Concept of Power in Statistical Tests
This paragraph addresses the potential for errors in statistical testing, explaining the concepts of Type I and Type II errors. A Type I error occurs when the null hypothesis is incorrectly rejected when it is actually true, while a Type II error happens when the null hypothesis is not rejected when it is actually false. The paragraph also introduces the concept of power, which is the probability of correctly rejecting a false null hypothesis. It discusses factors that can increase the power of a test, such as increasing the sample size or the level of significance, and the inherent trade-off with the risk of Type I errors.
🔑 Conclusion and Final Thoughts on Significance Testing
The final paragraph wraps up the discussion on significance testing for population proportions. It reiterates the importance of understanding the process and the rationale behind each step, rather than just mechanically following procedures. The paragraph emphasizes that no test is infallible and that conclusions are based on the data at hand, with an acknowledgment of the possibility of errors. It also mentions an upcoming video on significance testing for two samples, indicating a continuation of the topic.
Mindmap
Keywords
💡Inference
💡Significance Test
💡Null Hypothesis
💡Alternative Hypothesis
💡Sampling Distribution
💡Z-Test
💡Z-Score
💡P-Value
💡Type I Error
💡Type II Error
💡Power
Highlights
Inference for categorical data with an emphasis on proportions is the main focus of Unit 6.
Inference involves using sample statistics to make judgments about a population parameter.
Significance tests, also known as hypothesis tests, evaluate the truth of claims about population proportions.
A one-sample Z test for a population proportion is introduced as the method for testing claims based on a single sample.
The creation of hypotheses from a claim involves setting up a null hypothesis and an alternative hypothesis.
Three examples illustrate how hypotheses are formed and tested for different scenarios, including recycling rates, student understanding of scatter plots, and animal vertebrae proportions.
The importance of determining if the alternative hypothesis is greater than, less than, or not equal to the null hypothesis is discussed.
Building a sampling distribution for the sample proportion assumes the null hypothesis is true to model all possible sample proportions.
The mean and standard deviation of the sampling distribution are calculated based on the null hypothesis.
Three conditions necessary for building a valid sampling distribution are outlined: random sampling, sample size less than 10% of the population, and sufficient sample size for a normal model.
The process of conducting a one-sample Z test includes naming the test, defining the population proportion, stating hypotheses, checking conditions, building the sampling distribution, calculating the test statistic, finding the P value, and making a conclusion.
The significance level (Alpha) determines what is considered an unusual or low sample, typically set at 1% or 5%.
The Z score, or test statistic, measures how many standard deviations an observed sample proportion is from the mean.
The P value represents the probability of the observed sample proportion occurring or something even more extreme, given the null hypothesis is true.
The conclusion of a one-sample Z test is based on comparing the P value to the significance level, leading to either rejecting or failing to reject the null hypothesis.
The concept of errors in hypothesis testing includes Type I and Type II errors, with explanations of their implications and probabilities.
Power in statistical testing is the probability of correctly rejecting a false null hypothesis and is influenced by sample size, significance level, and the true proportion's distance from the null hypothesis.
The video concludes with a reminder that no test is perfect, and the possibility of errors exists, emphasizing the importance of understanding the concepts of errors and power in hypothesis testing.
Transcripts
Browse More Related Video
Hypothesis testing: step-by-step, p-value, t-test for difference of two means - Statistics Help
8.1.3 Basics of Hypothesis Testing - Computing and Interpreting Test Statistics

Hypothesis testing (ALL YOU NEED TO KNOW!)
Elementary Statistics Chapter 8 - Introduction Hypothesis Testing Part 1 Lesson 1
8.1.2 Basics of Hypothesis Testing - Significance Level, Type I and Type II Error
Hypothesis Testing: Calculations and Interpretations| Statistics Tutorial #13 | MarinStatsLectures
5.0 / 5 (0 votes)
Thanks for rating: