Standard Deviation & Degrees of Freedom Explained | Statistics Tutorial | MarinStatsLectures
TLDRThe video script delves into the concept of standard deviation, explaining its purpose as a measure of average deviation from the mean in a dataset. It guides viewers through a thought experiment to develop an intuitive understanding of the formula for standard deviation, starting with absolute deviations and moving towards squared deviations to account for negative and positive values. The script clarifies why the standard deviation is calculated using squared deviations and the square root, and introduces the concept of 'degrees of freedom' to explain why the denominator in the sample standard deviation formula is (n-1), emphasizing the loss of one degree of freedom when estimating the mean from the data.
Takeaways
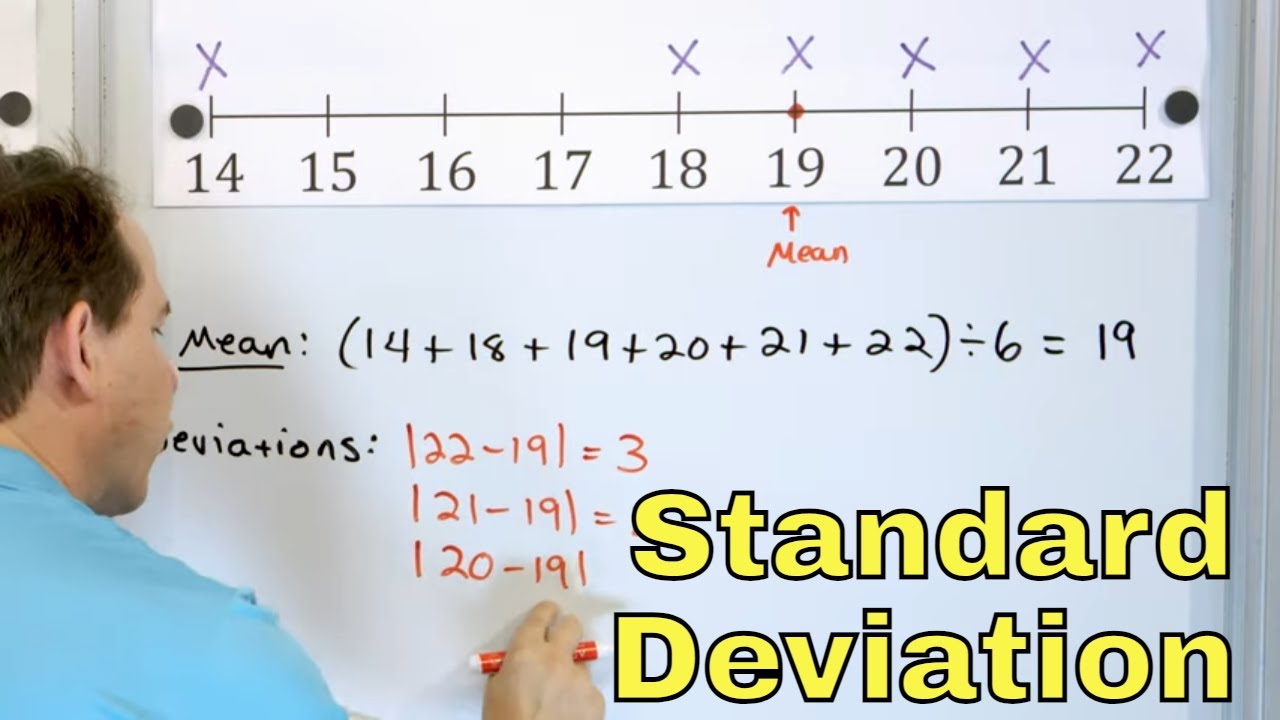
- 📈 The standard deviation measures the average distance of individual observations from the mean.
- 🤔 The concept behind standard deviation is to understand how much data deviates from the average.
- 🧠 A simple way to think about standard deviation is by considering it as the average absolute deviation from the mean.
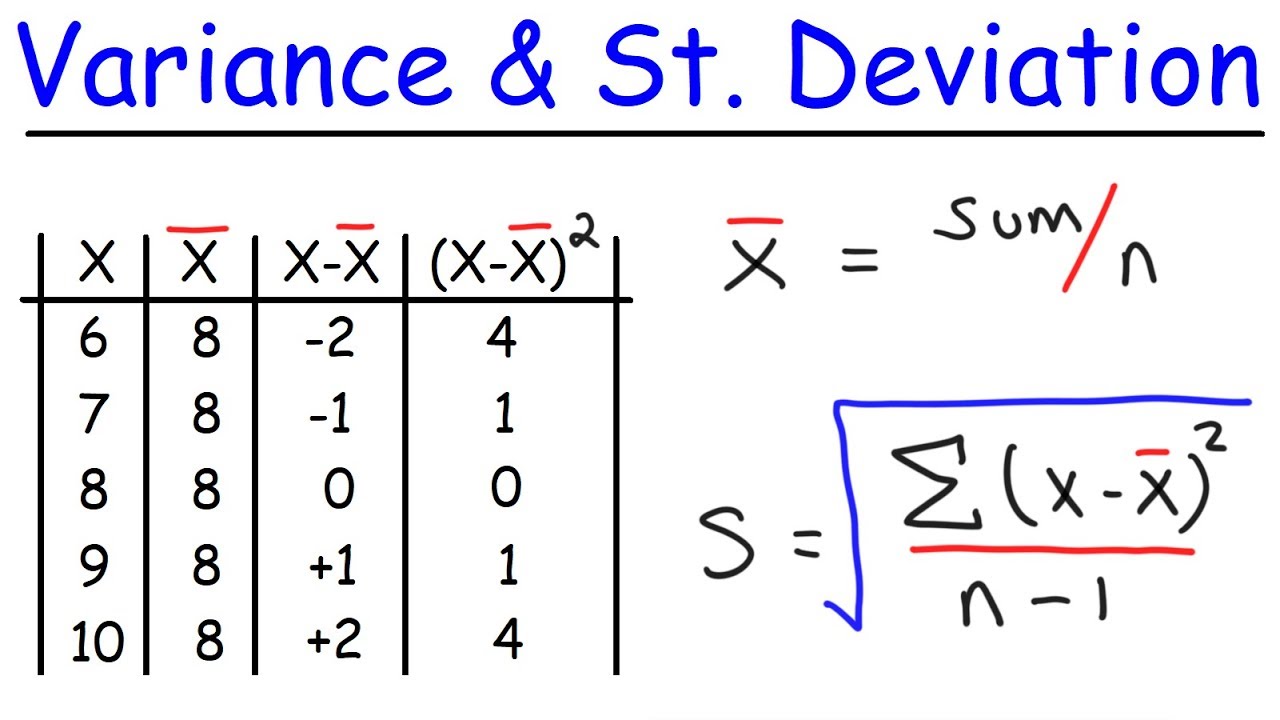
- 🔢 The formula for average absolute deviation is the sum of the absolute deviations of each observation from the mean, divided by the number of observations (n).
- 📊 However, using absolute values in the formula results in a non-smooth function, which is not ideal for analysis.
- 🟫 To address this, we use squared deviations instead of absolute values, leading to the concept of variance.
- 🔽 Squaring the deviations eliminates the issue of negative values and positive values canceling each other out.
- 📈 Variance is the average of the squared deviations and is represented as the sum of (Xi - Xbar)^2 over n.
- 🔄 The units of variance are squared units of the variable, which can be difficult to interpret.
- 🌱 To get back to the original units, we take the square root of the variance, resulting in the standard deviation.
- 🔄 The standard deviation is the square root of the average squared deviation and conceptually represents the average distance from the mean.
- 📌 When calculating sample standard deviation, we divide by (n-1) instead of n, which accounts for the loss of degrees of freedom when estimating the mean.
Q & A
What is the standard deviation trying to measure?
-The standard deviation is trying to measure the average distance that individual observations deviate from the mean of a dataset.
Why is the standard deviation often presented as a formula?
-The standard deviation is presented as a formula because it provides a mathematical way to quantify the dispersion or spread of a dataset around the mean.
What is the sample mean mentioned in the example?
-In the example, the sample mean is 80, which is the average value of the four observations given.
What is the concept behind the alternative formula using absolute values?
-The concept behind using absolute values in the alternative formula is to avoid negative and positive deviations canceling each other out, thus providing a more accurate measure of dispersion.
Why is the standard deviation preferred over the average absolute deviation?
-The standard deviation is preferred because it has nicer properties and is easier to work with mathematically. The average absolute deviation does not result in a smooth function, making it more difficult to handle in calculations and analysis.
What is the 'variance' in the context of the script?
-In the context of the script, 'variance' refers to the average of the squared deviations of observations from the mean, which is a measure of dispersion in the dataset.
Why are the units of variance in the units of the variable squared?
-The units of variance are in the units of the variable squared because it measures the average squared deviation from the mean, which results in squared units of the original variable.
How does the standard deviation relate to the concept of average deviation?
-The standard deviation can be conceptually thought of as the average deviation because it measures how far individual observations move from the mean. However, mathematically, it is the square root of the average squared deviation.
Why do we divide by (n-1) when calculating the sample standard deviation?
-We divide by (n-1) in the calculation of the sample standard deviation to account for the loss of degrees of freedom when estimating the mean from the same dataset. This adjustment is known as Bessel's correction.
What does the loss of one degree of freedom mean in the context of estimating the mean?
-In the context of estimating the mean, the loss of one degree of freedom means that when we use one observation to estimate the mean, we have one less piece of information to estimate the dispersion or standard deviation from the remaining observations.
How does the concept of degrees of freedom affect the calculation of standard deviation?
-The concept of degrees of freedom affects the calculation of standard deviation by requiring us to adjust our calculation to account for the information used to estimate the mean. This adjustment ensures that the standard deviation is an unbiased estimator of the population standard deviation.
Outlines
📊 Understanding Standard Deviation
This paragraph introduces the concept of standard deviation and its purpose in measuring the average distance that individual observations deviate from the mean. It emphasizes the importance of understanding the concept beyond just the formulaic approach. The speaker encourages viewers to create their own formula to capture this average deviation, leading to the idea of absolute deviations and their average. However, it points out the limitations of using absolute values due to their non-smooth function and the cancellation of positive and negative values.
📈 From Absolute Deviation to Variance
The speaker transitions from discussing absolute deviations to introducing the concept of variance, which is the average of squared deviations from the mean. This paragraph explains why squaring the deviations eliminates the issue of positive and negative values cancelling each other out. It also addresses the problem of variance having units squared, making it less interpretable. The solution presented is taking the square root of the variance to obtain the standard deviation, which has more meaningful units and represents the average deviation conceptually.
🧠 Degrees of Freedom and Sample Variance
This paragraph delves into the reason why the sample standard deviation formula divides by (n-1) instead of n. It explains the concept of degrees of freedom, where each observation provides one degree of freedom. When estimating the sample mean, one degree of freedom is lost, hence the use of (n-1) in the denominator. The speaker uses a conceptual explanation with examples to illustrate how each additional observation reduces the degrees of freedom and affects the calculation of the standard deviation, emphasizing the loss of one degree of freedom when the mean is estimated from the data.
Mindmap
Keywords
💡Standard Deviation
💡Variance
💡Sample Mean
💡Absolute Deviation
💡Squaring Deviations
💡Average Absolute Deviation
💡Degrees of Freedom
💡Average
💡Conceptual Understanding
💡Data Spread
💡Non-smooth Function
Highlights
The video discusses the concept and calculation of standard deviation, aiming to provide insight beyond the formulaic approach.
Standard deviation is a measure of the average distance that individual observations deviate from the mean.
The video introduces a thought experiment to develop a formula for capturing the average deviation from the mean.
The initial formula suggested involves taking the absolute values of deviations to avoid cancellation of positive and negative numbers.
The average of absolute deviations is conceptually similar to the standard deviation but lacks smooth mathematical properties.
The video explains the transition from absolute deviations to squared deviations to eliminate negative values.
Squaring the deviations leads to the concept of variance, which measures the average squared deviation from the mean.
Variance has units that are squared, making it less intuitive to interpret, which leads to the introduction of the standard deviation.
Standard deviation is the square root of the average squared deviation, which brings the units back to the original variable's scale.
The video clarifies why the standard deviation formula uses n-1 in the denominator, relating it to degrees of freedom.
The concept of degrees of freedom is introduced, explaining that using data to estimate something reduces the freedom to estimate other parameters.
The video provides an intuitive explanation for using n-1, showing how each observation used to estimate the mean reduces the available information for estimating deviations.
The video emphasizes the importance of understanding the conceptual basis behind statistical formulas for better comprehension.
The process of calculating standard deviation is shown to be more than just a mathematical formula, but a reflection of the underlying data's behavior.
The video encourages viewers to pause and think critically about statistical concepts before being presented with the standard methods.
The explanation of standard deviation and variance is grounded in practical examples, making the concepts more accessible.
The video's approach to teaching standard deviation emphasizes the need to understand the 'why' behind the calculations.
Transcripts
Browse More Related Video

Standard Deviation and Variance
Variance and Standard Deviation: Why divide by n-1?
Variance and Standard Deviation With Microsoft Excel - Descriptive Statistics
Standard Deviation & Mean Absolute Deviation Explained - 6-8-19]
Standard Error of the Mean: Concept and Formula | Statistics Tutorial #6 | MarinStatsLectures
What is a "Standard Deviation?" and where does that formula come from
5.0 / 5 (0 votes)
Thanks for rating: