Standard Error of the Mean: Concept and Formula | Statistics Tutorial #6 | MarinStatsLectures
TLDRThe video script delves into the concept of standard deviation and standard error in the context of sample means. It explains why the standard deviation of a sample mean is referred to as the standard error, and how it is calculated as the population standard deviation divided by the square root of the sample size (n). The explanation is grounded in properties of variance, such as the impact of constants on variance and the sum of variances for independent variables. The script clarifies that when dealing with a random, independent sample, the variance of the sample mean simplifies to the population variance divided by the sample size, leading to the standard deviation of the sample mean being the population standard deviation divided by the square root of the sample size.
Takeaways
- 📈 The standard deviation of the sample mean is often referred to as the standard error of the sample mean.
- 🔢 The formula for the standard error is the population standard deviation (σ) divided by the square root of the sample size (n).
- 🌐 The standard deviation of a constant times a variable (aX) is equal to the constant squared times the variance of the variable (a^2 * Var(X)).
- ➕ The variance of the sum of two independent variables (x1 + x2) is equal to the sum of their individual variances (Var(x1) + Var(x2)).
- 🔄 When calculating the variance of the sample mean, each individual observation's variance is assumed to be the same (σ^2).
- 📊 The variance of the sample mean is calculated by dividing the sum of the variances of individual observations by the sample size (n).
- 🌟 Since the observations in a random sample are assumed to be independent, their variances can be summed directly.
- 📉 The standard deviation of the sample mean (σX̄) is the square root of the variance of the sample mean (σ^2 / n).
- 📌 In practice, the population standard deviation (σ) is often replaced with the sample standard deviation when working with sample data.
- 🔄 The process of deriving the standard error involves step-by-step application of variance properties and assumptions about the sample data.
- 📈 Understanding the standard error is crucial for making inferences about population parameters from sample data.
Q & A
Why is the standard deviation of the sample mean referred to as the standard error of the sample mean?
-The standard deviation of the sample mean is called the standard error because it measures the average amount of error or deviation from the true population mean that we would expect if we were to take multiple samples of size n from the same population. It is an estimate of the precision of the sample mean as an estimator of the population mean.
What is the relationship between the standard deviation of individual observations and the standard deviation of the sample mean?
-The standard deviation of the sample mean (standard error) is equal to the standard deviation of the individual observations (Sigma) divided by the square root of the sample size (n). This relationship is derived from the properties of variance and the assumption that the observations are independent.
What are the two properties used to derive the formula for the standard deviation of the sample mean?
-The two properties used are: (1) the variance of a constant times a random variable is equal to the constant squared times the variance of the random variable, and (2) the variance of the sum of two independent random variables is equal to the sum of their individual variances.
How does the variance of the sample mean relate to the variance of the individual observations in a sample?
-The variance of the sample mean is the sum of the variances of the individual observations divided by the square of the sample size (n). Since all observations in a random sample are assumed to have the same variance (Sigma squared), the variance of the sample mean is n times Sigma squared divided by n, which simplifies to Sigma squared divided by n.
What is the assumption made about the observations in a random sample when calculating the standard deviation of the sample mean?
-The assumption is that all observations in the random sample have the same mean and variance, and that the observations are independent of each other.
What does the formula Sigma over the square root of n represent?
-The formula Sigma over the square root of n represents the standard deviation of the sample mean, also known as the standard error of the sample mean, which is used to estimate the precision of the sample mean as an estimator of the population mean.
How does the standard error of the sample mean change as the sample size increases?
-As the sample size (n) increases, the standard error of the sample mean decreases, which means that the sample mean becomes a more precise estimator of the population mean.
What is the significance of the standard error in statistical inference?
-The standard error is significant in statistical inference because it provides a measure of the variability of the sample mean and helps in constructing confidence intervals and conducting hypothesis tests about the population mean.
In the context of the script, what does Sigma represent?
-In the context of the script, Sigma represents the standard deviation of the individual observations in the sample, which is a measure of the dispersion or variability of those observations.
How does the concept of independence affect the calculation of the variance of the sample mean?
-The concept of independence is crucial because it allows us to assume that the variances of the individual observations can be added together when calculating the variance of the sample mean. If the observations were not independent, we could not simply sum their variances.
What happens to the precision of the sample mean if we assume the observations are not independent?
-If the observations are not independent, we cannot use the simplifying assumption that allows us to sum their variances directly. This would mean that the calculations for the variance of the sample mean and its standard error would be more complex, and the precision of the sample mean as an estimator might not be accurately reflected.
Outlines
📊 Understanding the Standard Error of the Sample Mean
This paragraph delves into the concept of standard deviation in the context of sample means. It explains why the standard deviation of a sample mean is referred to as the standard error. The discussion begins with the foundational properties of variance, including the impact of constants on variance and the sum of variances for independent variables. The explanation progresses to describe how the variance of the sample mean (X bar) is derived, emphasizing the role of the sample size (n) and the population standard deviation (Sigma). The paragraph concludes with the derivation of the formula for the standard error, which is Sigma over the square root of n, highlighting the transition from population to sample statistics in statistical analysis.
🚫 Incomplete Paragraph - Missing Context
The second paragraph appears to be incomplete and lacks context. It starts with an abrupt sentence that seems unrelated to the statistical discussion from the first paragraph. The content provided is insufficient for a detailed summary, as it does not offer a clear theme or sufficient information to understand the intended message.
Mindmap
Keywords
💡Standard Deviation
💡Sample Mean
💡Variance
💡Sigma
💡Square Root of n
💡Standard Error
💡Independent Random Sample
💡Population
💡Sample Size
💡Properties of Variance
Highlights
The standard deviation of the sample mean is referred to as the standard error of the sample mean.
The standard deviation of the sample mean is calculated as Sigma over the square root of n, where Sigma is the standard deviation of the population.
The variance of a constant times a random variable is equal to the constant squared times the variance of the random variable.
The variance of the sum of two independent random variables is equal to the sum of their individual variances.
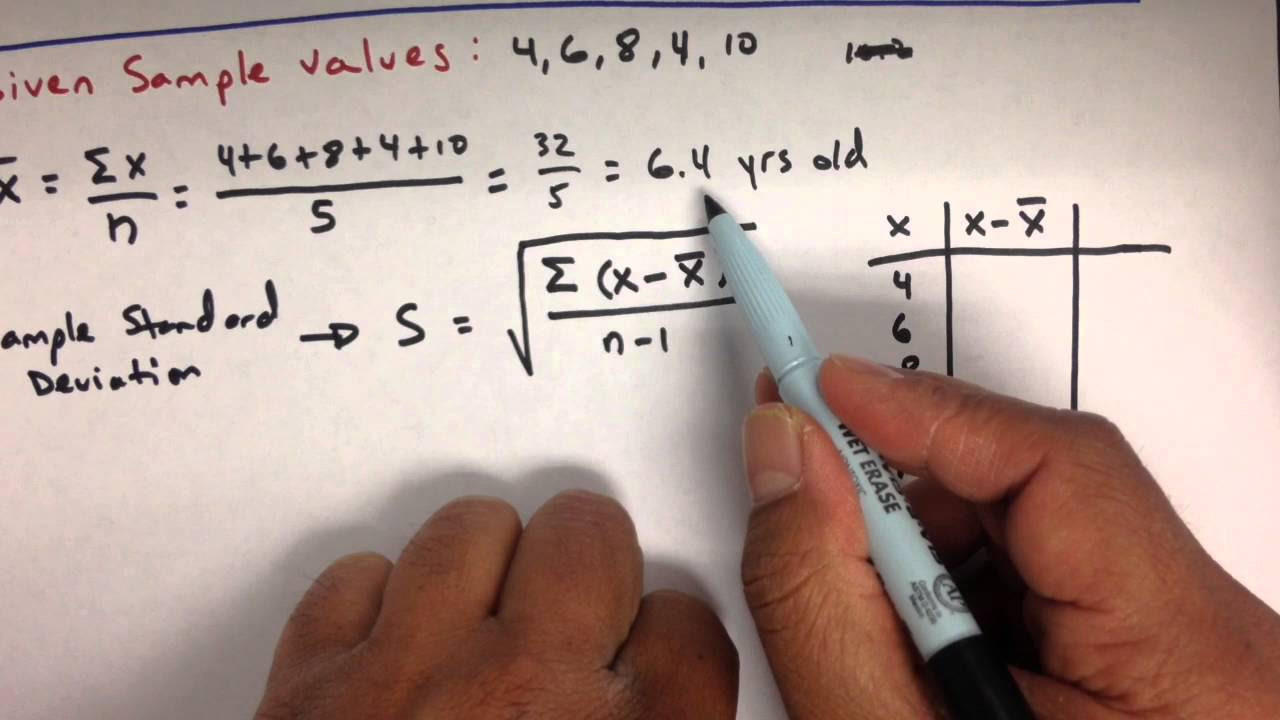
The sample mean is calculated by dividing the sum of the sample data points by the sample size.
The variance of the sample mean is found by dividing the variance of each individual data point by the square of the sample size.
The assumption is made that each data point in the sample has the same mean and variance, indicating that the sample is randomly drawn from the population.
The process starts by working with the variance of the sample mean, which is expressed as the variance of the sum of the data points divided by the sample size.
The constant (1/n) is factored out of the variance when working with the sample mean, which simplifies the expression.
Since the sample data points are assumed to be independent, the variance of their sum can be expressed as the sum of their individual variances.
Each observation in the sample has the same variance, denoted as Sigma squared, which is the standard deviation squared.
The variance of the sample mean is calculated as Sigma squared divided by the sample size (n).
The standard deviation of the sample mean, or standard error, is the square root of the variance of the sample mean.
The standard error is used when dealing with sample data instead of population data, and it is represented by the sample standard deviation.
The derivation of the standard error formula demonstrates the relationship between the sample size and the precision of the estimate of the population mean.
The standard error decreases as the sample size increases, leading to a more precise estimate of the population mean.
Transcripts
Browse More Related Video

Standard error of the mean | Inferential statistics | Probability and Statistics | Khan Academy
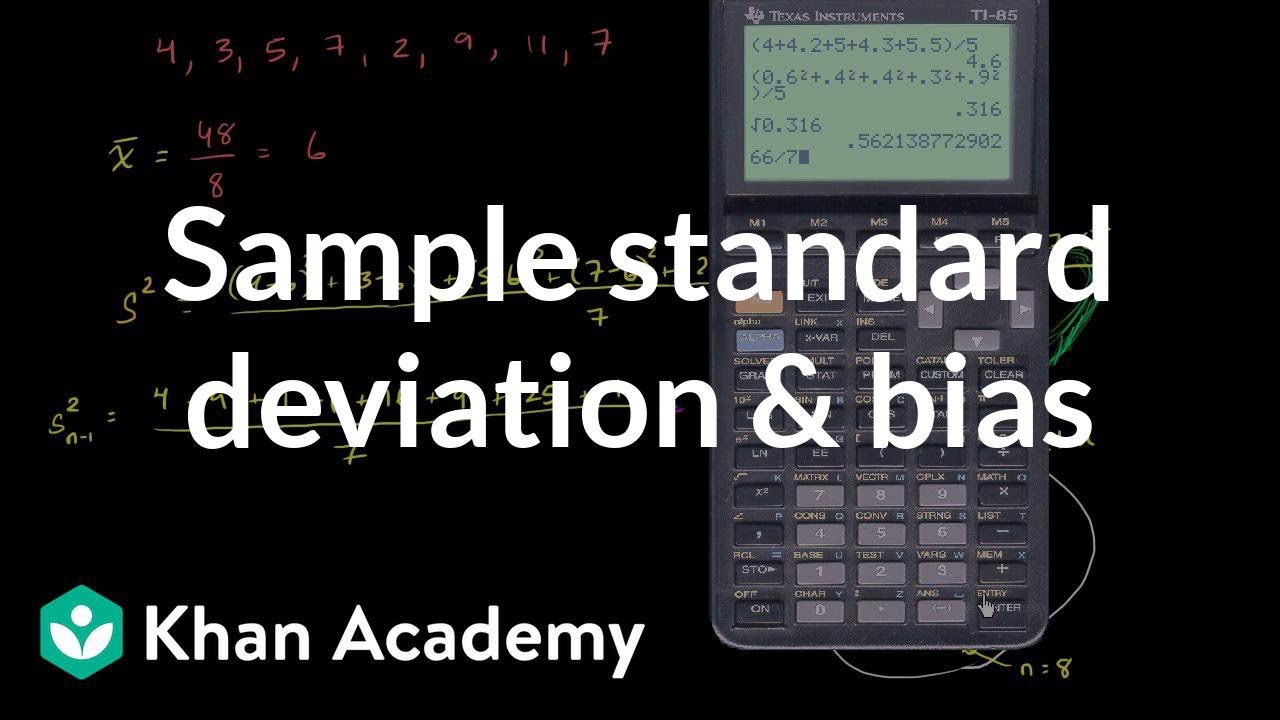
Sample standard deviation and bias | Probability and Statistics | Khan Academy
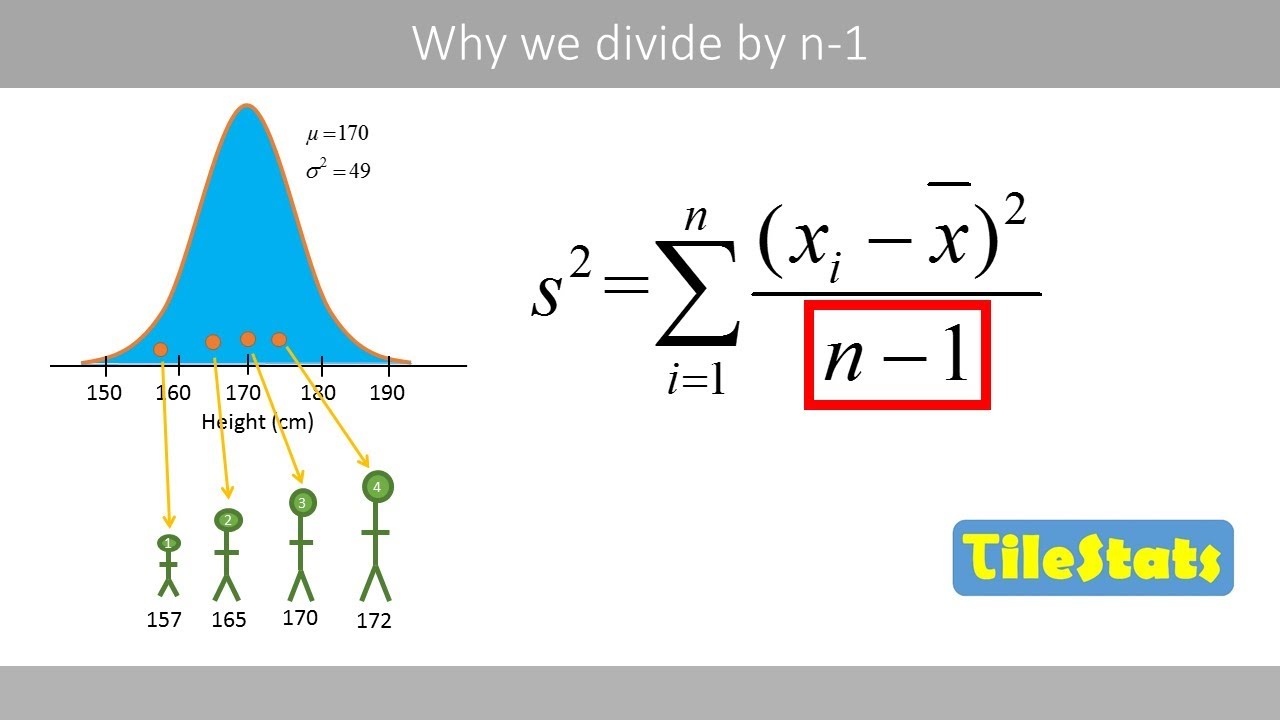
Why do we divide by n-1 and not n? | shown with a simple example | variance and sd
6.4.1 The Central Limit Theorem - What the Central Limit Theorem Says and What It Doesn't Say
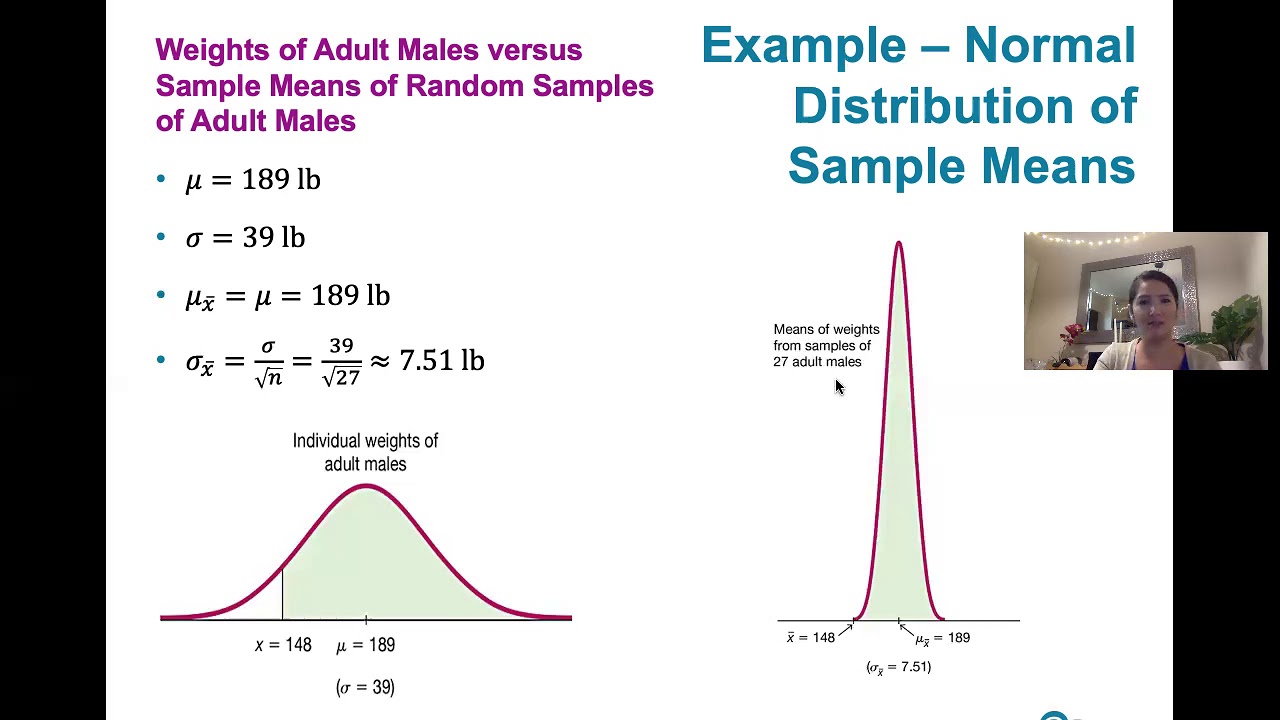
The Sampling Distribution of the Sample Mean
Variance and Standard Deviation: Sample and Population Practice Statistics Problems
5.0 / 5 (0 votes)
Thanks for rating: