Quality (Part 2: Ishikawa Diagram)
TLDRIn this informative presentation, Professor Cummings introduces the Ishikawa diagram, a systematic problem-solving tool developed in the 1960s. He explains its use in identifying and organizing potential causes of a problem through visual categorization, emphasizing its benefits for structured brainstorming and root cause analysis. The professor also outlines the steps to effectively utilize the diagram, from establishing the problem to investigating causes, using a car painting scenario as an example. This video serves as a practical guide for those seeking to enhance their problem-solving skills with a clear and organized approach.
Takeaways
- 📚 The Ishikawa diagram, also known as a cause and effect diagram or fishbone diagram, is a problem-solving tool developed in the 1960s by an engineer named Ishikawa.
- 🔍 It is based on a well-established problem statement and helps to break down the problem into possible causes within finite categories.
- 📊 The diagram is highly visual, making it easy to see the problem and its potential causes, facilitating open discussion and quick analysis.
- 👥 It is typically used in a team setting with cross-functional members, leveraging diverse skills and perspectives for a comprehensive brainstorming session.
- 🔨 The Ishikawa diagram is systematic and organized, preventing wasted time and ensuring a clear path to identifying potential causes of a problem.
- 🔍 It provides a method to establish a problem and systematically drive towards finding the root cause.
- 🛠️ Common categories used in the diagram include Manpower, Machine, Method, Environment, Material, and sometimes Measurement.
- 💡 The brainstorming process involves writing potential causes under each category, ensuring a structured approach to identifying issues.
- ⚠️ It's important not to let the diagram become too complex, as it should remain a clear and manageable visual tool.
- 🔬 After identifying potential causes, the next step is to investigate them for validity, testing whether they are truly contributing to the problem.
- 🚀 The Ishikawa diagram helps in taking action by providing a systematic method to approach problem-solving based on categorized causes.
- 🎨 An example given in the script involves a car painting shop addressing customer complaints about paint thickness and tackiness, illustrating the practical application of the Ishikawa diagram.
Q & A
What is an Ishikawa diagram also known as?
-An Ishikawa diagram is also known as a cause and effect diagram or a fishbone diagram.
When was the Ishikawa diagram developed?
-The Ishikawa diagram was developed in the 1960s.
Who is credited with the creation of the Ishikawa diagram?
-The Ishikawa diagram was created by an engineer named Ishikawa.
What is the primary purpose of an Ishikawa diagram?
-The primary purpose of an Ishikawa diagram is to serve as a problem-solving tool.
What does the term 'cause and effect' in the Ishikawa diagram represent?
-In the Ishikawa diagram, 'cause and effect' represents the relationship between the potential causes and the effect, which is the problem being analyzed.
What are the typical categories used in an Ishikawa diagram for a manufacturing environment?
-The typical categories used in a manufacturing environment are Manpower, Machine, Material, Method, and Environment, with sometimes an additional category for Measurement.
What are the benefits of using an Ishikawa diagram?
-The benefits of using an Ishikawa diagram include its visual nature, systematic approach, organization, and the ability to establish a problem and drive towards a root cause.
How should an Ishikawa diagram be created?
-An Ishikawa diagram should be created with a cross-functional team, representing different skills and perspectives, through a systematic and organized brainstorming session.
What is the first step in using an Ishikawa diagram?
-The first step in using an Ishikawa diagram is to establish a clear problem statement that everyone in the group understands.
What should be done after creating the Ishikawa diagram?
-After creating the Ishikawa diagram, one should investigate the potential causes for their validity and see if they are truly contributing to the problem.
Can you provide an example of how an Ishikawa diagram could be used?
-An example given in the script is a car painting shop facing complaints about the paint being too thick and tacky. The Ishikawa diagram is used to identify potential causes across categories like Manpower, Machine, Method, Environment, and Material.
Outlines
📚 Introduction to Ishikawa Diagrams
Professor Cummings introduces the Ishikawa diagram, also known as a cause and effect or fishbone diagram, as a problem-solving tool developed in the 1960s. He explains that it is based on a well-established problem statement and involves breaking down the problem into possible causes within specific categories, such as manpower, machine, material, method, and environment. The benefits of using this diagram include its visual nature, systematic approach, and organization, which aids in identifying the root cause of a problem. The process begins with a cross-functional team brainstorming session to identify potential causes and then moves on to investigating these causes for validity.
🔍 Establishing the Problem and Categories
The second paragraph delves into the steps for utilizing an Ishikawa diagram. It emphasizes the importance of establishing a clear problem statement as the foundation for the diagram. The speaker then discusses the categorization process, which typically includes man, machine, method, environment, and material, but can be adapted to fit the specific context of the organization. The paragraph highlights the brainstorming session where potential causes are identified under each category, cautioning against letting the diagram become too complex. The ultimate goal is to investigate these causes to determine their validity in contributing to the problem.
🛠️ Utilizing the Ishikawa Diagram for Problem Analysis
In this paragraph, the application of the Ishikawa diagram is exemplified through a scenario where a car painting shop is facing complaints about the quality of their paint job. The problem statement is clearly defined as the paint being too thick and tacky. The speaker breaks down the brainstorming process into the typical categories, hypothesizing potential causes such as training issues, equipment malfunction, environmental factors, poor quality materials, and lack of standardized procedures. The emphasis is on the structured approach to identifying and investigating these causes to reach the root of the problem.
📘 Follow-up on Ishikawa Diagram Results
The final paragraph focuses on the follow-up actions after creating an Ishikawa diagram. It stresses the importance of not just brainstorming and categorizing but also of investigating the identified causes to confirm their validity. The speaker suggests interviewing employees, inspecting equipment, and reviewing procedures to understand the root causes of the problem. The paragraph concludes by emphasizing the systematic and organized nature of the Ishikawa diagram as a methodical approach to problem-solving, aiming to reduce time wasted and efficiently address the issue at hand.
📢 Conclusion and Additional Resources
Professor Cummings concludes the video by inviting viewers to subscribe for more content and follow him on social media platforms for further insights into manufacturing and engineering. He mentions his Facebook page, Twitter account, and Google+ communities where he shares videos and articles related to manufacturing skills and engineering. The paragraph serves as a call to action for viewers to engage with the content and the community for ongoing learning and problem-solving discussions.
Mindmap
Keywords
💡Ishikawa Diagram
💡Problem Statement
💡Brainstorming
💡Manpower
💡Machinery
💡Materials
💡Methods
💡Environment
💡Measurement
💡Root Cause
💡Systematic Approach
Highlights
Introduction to Ishikawa diagrams, also known as cause and effect diagrams or fishbone diagrams, as problem-solving tools.
Historical context of Ishikawa diagrams, developed in the 1960s by an engineer named Ishikawa.
Explanation of the diagram's structure, focusing on problem statements and categorization of possible causes.
Common categories used in manufacturing environments: Manpower, Machine, Material, Method, and Environment.
The inclusion of the Measurement category to account for gauging and quality tools in the cause and effect analysis.
Benefits of using Ishikawa diagrams, including their visual nature, systematic approach, and organization.
The importance of establishing a clear problem statement before beginning the diagramming process.
The collaborative nature of Ishikawa diagrams, involving a cross-functional team for brainstorming.
The process of setting up an Ishikawa diagram, starting with the problem statement and moving to categorization.
The brainstorming session's role in identifying potential causes within each category.
Advice on managing the brainstorming process to avoid the diagram becoming too complex.
The necessity of investigating and validating the potential causes identified in the diagram.
An example of using an Ishikawa diagram to address paint application issues in a car painting shop.
The systematic approach to follow-up on the Ishikawa diagram results, including investigation and employee interviews.
The importance of inspection and testing of equipment, procedures, and materials as part of the follow-up process.
The final step of using the Ishikawa diagram to understand and approach the problem methodically, aiming for root cause analysis.
Closing remarks by Professor Cummings, including additional resources and social media presence for further learning.
Transcripts
Browse More Related Video

The 7 Quality Control (QC) Tools Explained with an Example!

My Solutions to the British Physics Olympiad, BPhO Senior Challenge 2019 Multiple Choice
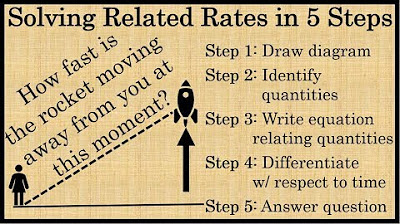
How to Solve Related Rates Problems in 5 Steps :: Calculus

Related Rates Cone Example (Calculus)
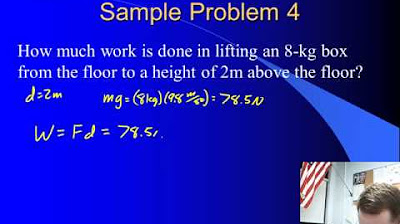
High School Physics - Work
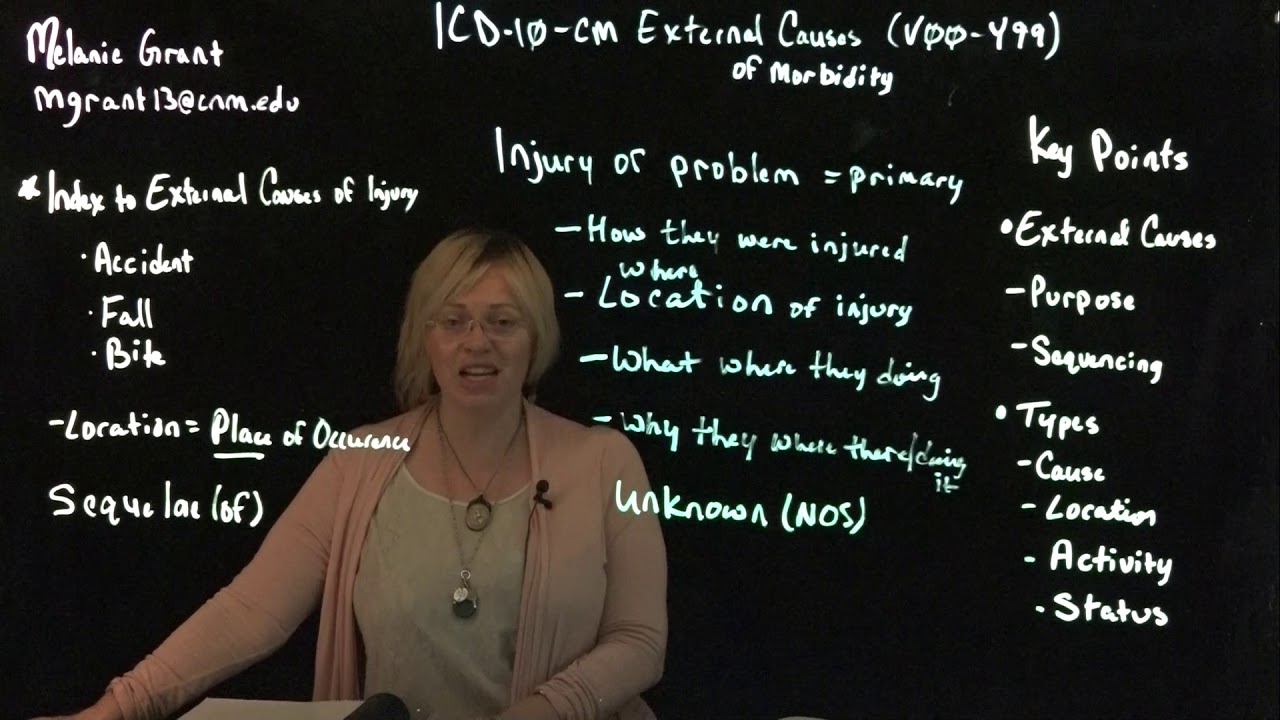
ICD 10 CM Ch 20 External Causes of Morbidity
5.0 / 5 (0 votes)
Thanks for rating: