Variance and standard deviation of a discrete random variable | AP Statistics | Khan Academy
TLDRThis educational video explains the concept of variance and standard deviation for a discrete random variable, using the example of the number of workouts one might do in a week. The instructor calculates the expected value (mean) of the variable as 2.1, then demonstrates how to find the variance by squaring the difference between each outcome and the mean, and multiplying by the outcome's probability. The standard deviation, denoted by sigma, is the square root of the variance, which in this case is approximately 1.09. The video also visually represents the probability distribution and its mean and standard deviation on a number line.
Takeaways
- 📚 The script discusses a discrete random variable 'x', which represents the number of workouts in a week and has a finite number of possible values.
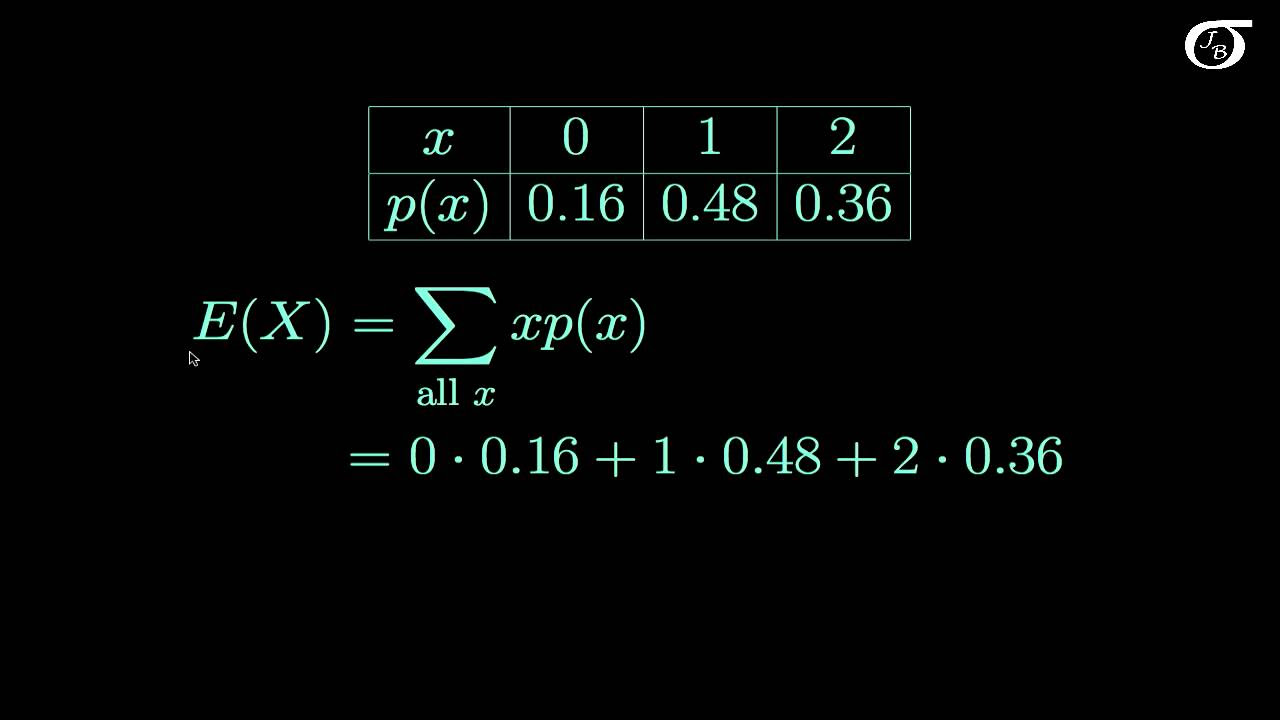
- 🧩 The expected value (mean) of 'x' is calculated as 2.1, using the formula for the probability-weighted sum of outcomes.
- 📈 The concept of variance is introduced as a measure of spread for the random variable 'x', calculated by taking the squared difference from the mean, multiplying by the probability of each outcome, and summing these products.
- 📊 The variance calculation involves specific steps: subtract the mean from each outcome, square the result, multiply by the outcome's probability, and sum these values.
- 🔢 The variance for the given distribution is calculated to be 1.19 by following the steps outlined in the script.
- 🌐 The standard deviation, denoted by sigma (σ), is the square root of the variance, which is approximately 1.09 for this random variable.
- 📐 A number line visualization is used to represent the outcomes and their probabilities, with the mean (2.1) and standard deviation (1.09) indicated.
- 📉 The mean can be a non-integer value even though the random variable takes on integer values, demonstrating the flexibility of statistical measures.
- 📊 The standard deviation provides a measure of the spread of the distribution, with 1.09 units above and below the mean indicating the range of typical outcomes.
- 🤔 The script encourages a conceptual understanding of the mean and standard deviation by relating them to the shape and spread of the distribution on the number line.
- 📝 The process of calculating variance and standard deviation is parallel to previous methods, reinforcing the continuity of statistical learning.
Q & A
What is a discrete random variable?
-A discrete random variable is a type of random variable that can only take on a finite number of distinct values, as opposed to a continuous random variable which can take on an infinite number of values within a range.
What does the instructor define the random variable x as in the script?
-In the script, the instructor defines the random variable x as the number of workouts one might do in a week.
What is the expected value of a random variable, and how is it calculated?
-The expected value of a random variable, often denoted by the Greek letter mu (μ), is a measure of the central tendency of the random variable. It is calculated as the probability-weighted sum of all possible outcomes of the random variable.
What is the mean of the random variable x in the given script?
-The mean of the random variable x, as calculated in the script, is 2.1.
What is variance and how is it related to the spread of a random variable?
-Variance is a measure of the dispersion or spread of a set of data points. It is calculated as the average of the squared differences from the mean. In the context of a random variable, it measures the spread of the possible outcomes around the mean.
How is the variance of a random variable calculated?
-The variance of a random variable is calculated by taking the difference between each outcome and the mean, squaring that difference, and then multiplying it by the probability of that outcome, summing all these products to get the variance.
What is the standard deviation and how is it related to variance?
-The standard deviation is a measure of the amount of variation or dispersion in a set of values. It is the square root of the variance and provides a measure of the spread of a random variable in the same units as the original data.
What is the standard deviation of the random variable x as calculated in the script?
-The standard deviation of the random variable x, as calculated in the script, is approximately 1.09.
How does the instructor visualize the probability distribution of the random variable x?
-The instructor visualizes the probability distribution of the random variable x on a number line, with each outcome represented by its probability as a height on the vertical axis, and the mean marked at 2.1.
What does the instructor conclude about the mean and standard deviation of the random variable x?
-The instructor concludes that the mean of 2.1 is indicative of the central tendency of the distribution, and the standard deviation of 1.09 is a reasonable measure of the spread, with values approximately 1.09 above and below the mean.
How does the instructor demonstrate that the mean can be a non-integer value even when the random variable takes on only integer values?
-The instructor demonstrates this by showing that the calculated mean of the random variable x, which takes on integer values, is 2.1, a non-integer value, which is a result of the probability-weighted sum of the outcomes.
Outlines
📚 Introduction to Variance and Standard Deviation
The instructor begins by referencing a previous video where a discrete random variable 'x' was defined as the number of workouts one might do in a week. The expected value, or mean, of 'x' was calculated to be 2.1 using a probability-weighted sum of outcomes. The current lesson extends this concept to measure the spread of 'x' by introducing the variance and standard deviation. Variance is calculated by taking the squared difference between each outcome and the mean, multiplying by the outcome's probability. The process involves squaring the difference for each data point (e.g., (0-2.1)^2 * 0.1 for zero workouts), and summing these products to find the variance. The standard deviation is then found by taking the square root of the variance.
📊 Visualization of Probability Distribution and Spread
The second paragraph continues the discussion by visualizing the discrete probability distribution on a number line, with the outcomes of zero to four workouts and their respective probabilities. The mean of 2.1 is noted to be indicative of the central tendency of the distribution, even though it's a non-integer value. The standard deviation, calculated to be approximately 1.09, is used to estimate the spread around the mean. The instructor illustrates that 1.09 units above and below the mean would approximately reach the values of 3.2 and 1, respectively, providing an intuitive understanding of the distribution's spread and central tendency.
Mindmap
Keywords
💡Random Variable
💡Discrete Random Variable
💡Expected Value
💡Mean
💡Variance
💡Standard Deviation
💡Probability Distribution
💡Spread
💡Square Root
💡Central Tendency
💡Number Line
Highlights
Introduction to the random variable x, defined as the number of workouts per week.
Explanation of x as a discrete random variable with finite values.
Calculation of the expected value (mean) of x, denoted as μ (mu).
Mean of the random variable x calculated as 2.1.
Introduction to the concept of measuring spread: variance and standard deviation.
Method to calculate variance: difference between each outcome and the mean, squared, and weighted by the probability.
Example calculation of variance term for outcome 0: (0 - 2.1)^2 * 0.1.
Example calculation of variance term for outcome 1: (1 - 2.1)^2 * 0.15.
Example calculation of variance term for outcome 2: (2 - 2.1)^2 * 0.4.
Example calculation of variance term for outcome 3: (3 - 2.1)^2 * 0.25.
Example calculation of variance term for outcome 4: (4 - 2.1)^2 * 0.1.
Sum of all variance terms calculated as 1.19.
Standard deviation of x calculated as the square root of variance: √1.19 ≈ 1.09.
Visualization of the probability distribution of x.
Mean of 2.1 placed on the number line, showing non-integer mean for integer outcomes.
Standard deviation of 1.09 shown to indicate spread around the mean, validating the calculation.
Transcripts
Browse More Related Video
Expected Value and Variance of Discrete Random Variables
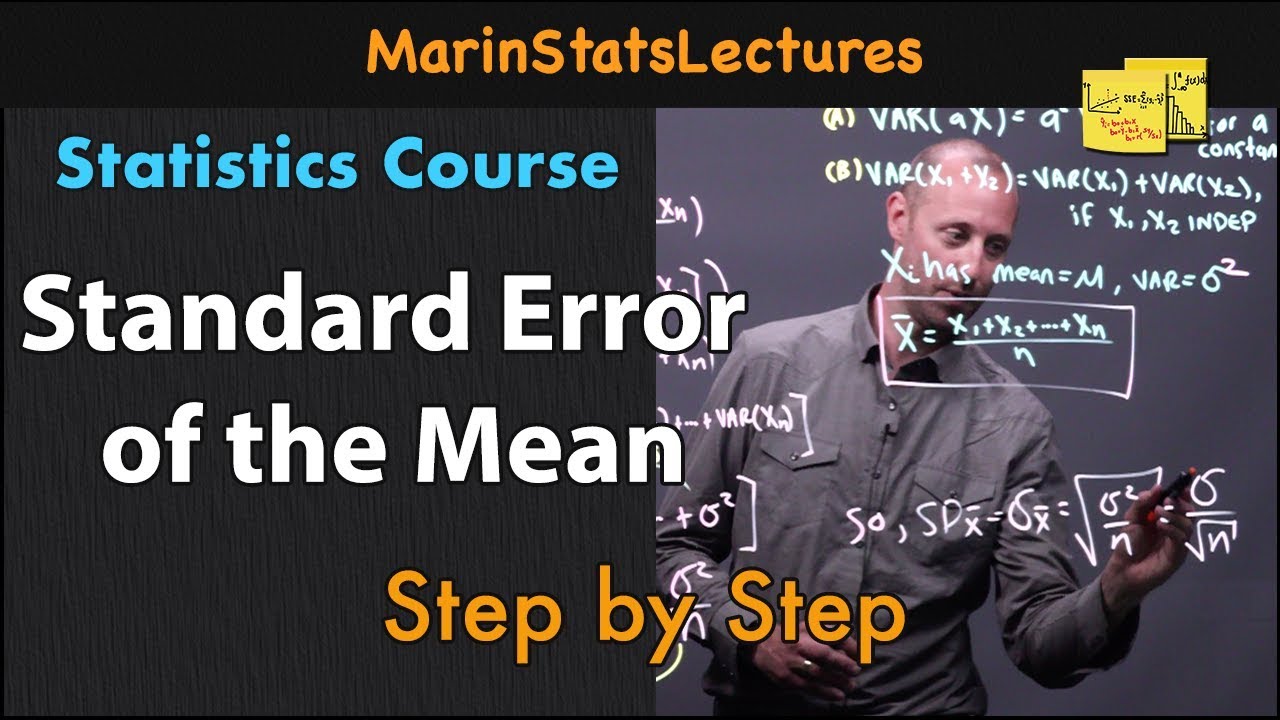
Standard Error of the Mean: Concept and Formula | Statistics Tutorial #6 | MarinStatsLectures
Lecture 14: Location, Scale, and LOTUS | Statistics 110
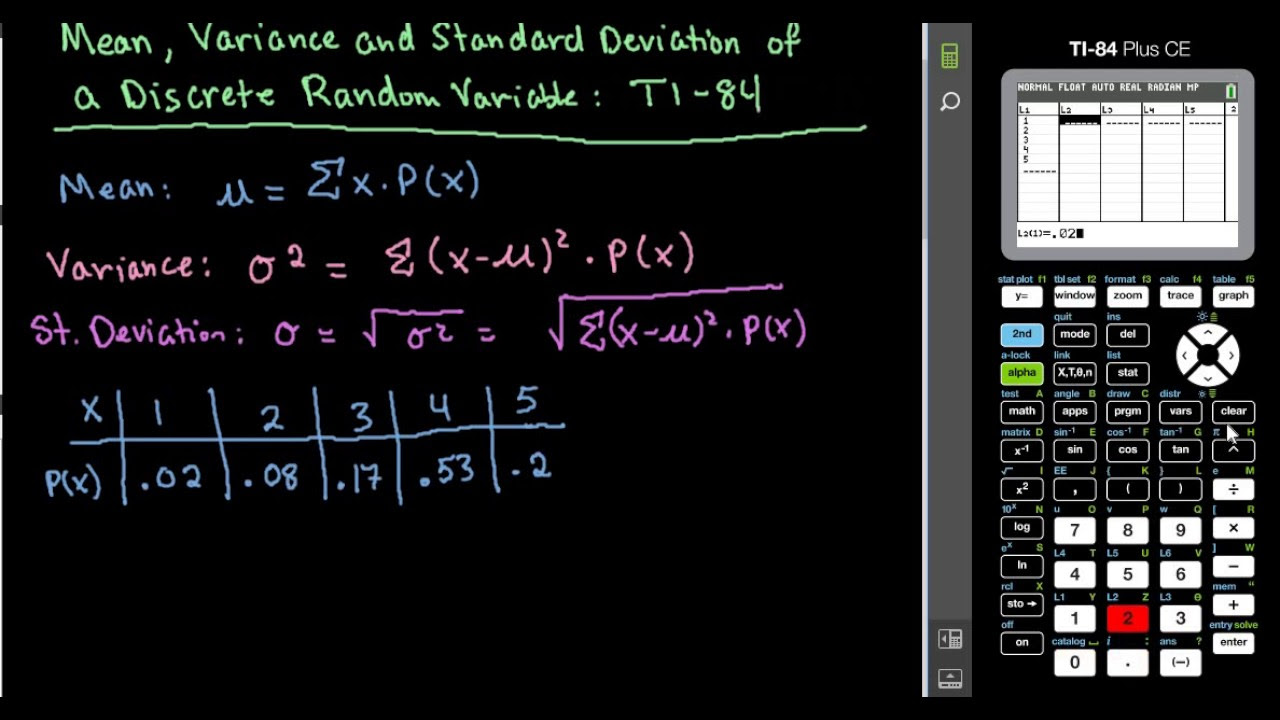
Mean, Variance, and Standard Deviation of Discrete Random Variable-TI-84
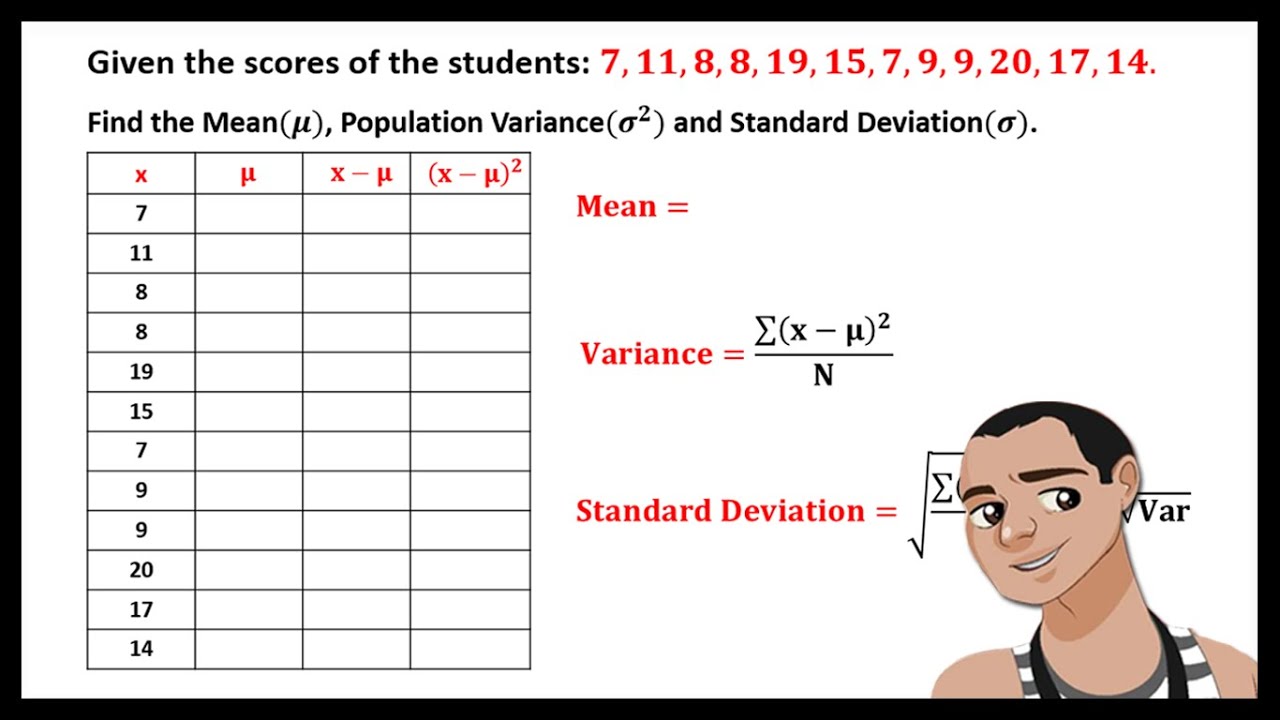
MEAN, VARIANCE, AND STANDARD DEVIATION FOR UNGROUPED DATA
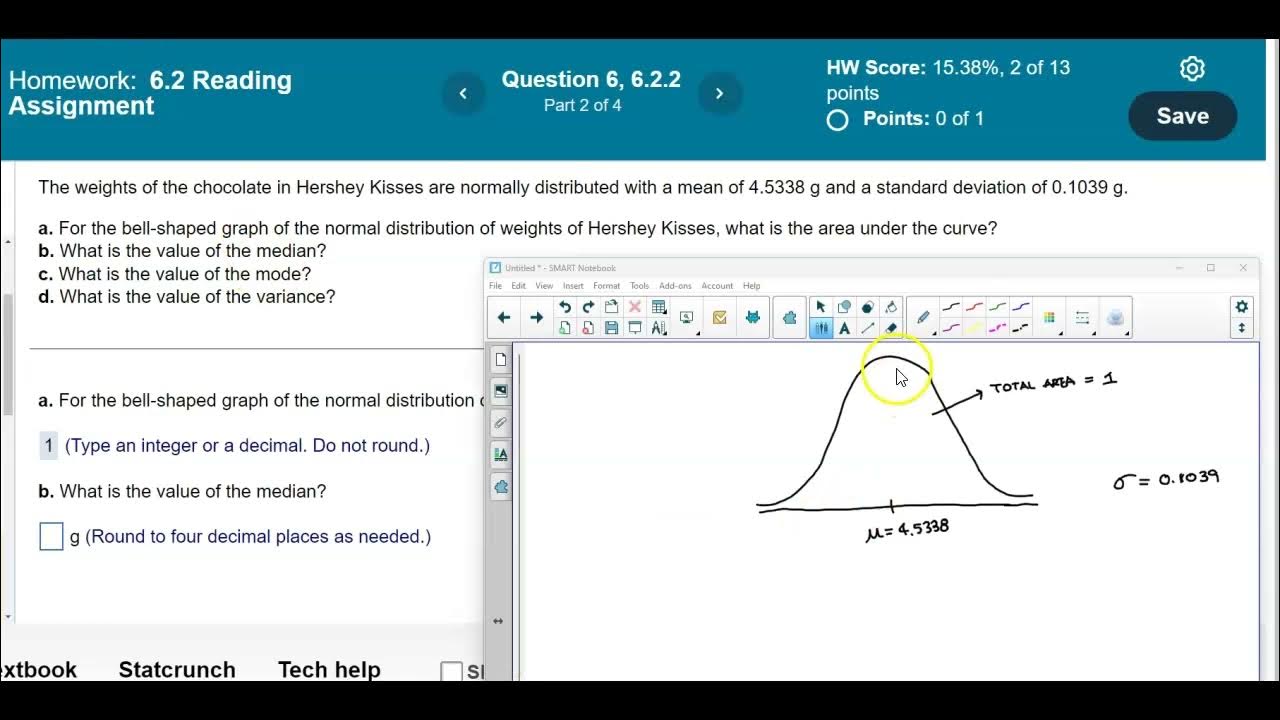
Math 14 6.2.2 What is the area under the curve & values of the median, mode & variance?
5.0 / 5 (0 votes)
Thanks for rating: