Expected Value and Variance of Discrete Random Variables
TLDRThis video script delves into the concepts of expectation and variance for discrete random variables. It explains how to calculate the expected value (mean) of a random variable using its distribution, emphasizing that it is a theoretical parameter, not based on sample data. The script also covers the variance, which measures the average squared distance from the mean, and introduces a formula to calculate it. An example is provided using the approval rate of a president among randomly sampled adults, demonstrating the calculation of both the mean and variance, and concluding with the standard deviation. The script highlights a useful relationship between the expectation of X squared and the variance, verifying its validity with the example.
Takeaways
- 📚 The script discusses the expectation and variance of discrete random variables, providing a foundational understanding of these concepts.
- 📉 Discrete random variable X can take on values such as 0, 1, or 2, each with its own probability.
- 🧮 The expected value (mean) of a random variable is calculated using the formula E(X) = Σ(x * P(x)) for all possible values of X.
- 📈 The expectation of a function of the random variable, like G(X), is calculated similarly by taking the function's values, multiplying by their probabilities, and summing them up.
- 📊 Variance measures the average squared distance from the mean and is calculated as E(X - μ)², where μ is the mean.
- 🔢 Variance can also be expressed as E(X²) - (E(X))², which can be useful for calculations and avoiding rounding errors.
- 🇺🇸 An example is given using the approval of the president's job performance among American adults, with X representing the number of adults who approve.
- 📝 The probability distribution for the example is calculated based on the given approval rate and the random sampling of two adults.
- 🔢 The mean of the random variable X in the example is found to be 1.2, which is not one of the possible values of X but represents the theoretical mean.
- 📊 The variance of the random variable X in the example is calculated to be 0.48, indicating the dispersion of the values around the mean.
- 📐 The standard deviation is the square root of the variance, which for the example is √0.48, providing a measure of the spread of the data.
Q & A
What is a discrete random variable?
-A discrete random variable is a variable that can take on a countable number of distinct values, such as 0, 1, 2, etc., and each value has an associated probability of occurring.
What is the expected value of a discrete random variable?
-The expected value, often denoted by E(X) or μ, is the theoretical mean of the random variable, calculated as the sum of each value of X multiplied by its probability of occurrence.
How is the expected value of a function of a random variable calculated?
-The expected value of a function of a random variable, G(X), is calculated by summing the product of each value of the function and its corresponding probability of occurrence.
What is the variance of a random variable?
-Variance, denoted by σ², measures the average squared distance from the mean; it is calculated as the expectation of (X - μ)², where μ is the mean of the random variable.
Why is the variance considered an important quantity in statistics?
-Variance is important as it provides a measure of the dispersion or spread of the distribution of a random variable, indicating how much the values deviate from the mean.
What is the relationship between the expectation of X squared and the variance of X?
-The variance of X can be expressed as E(X²) - (E(X))², which is the expectation of X squared minus the square of the expectation of X.
How can the variance be used to calculate the standard deviation?
-The standard deviation, denoted by σ, is the square root of the variance and provides a measure of the average distance from the mean in the same units as the data.
What is the difference between a parameter and a statistic?
-A parameter is a characteristic of the entire population, such as the mean or variance, while a statistic is an estimate of a parameter based on a sample of data.
In the context of the script, what does the random variable X represent in the example of American adults' approval of the president?
-In the given example, X represents the number of randomly sampled American adults who approve of the president's job performance.
How are the probabilities for the values of X in the example calculated?
-The probabilities for the values of X (0, 1, 2) are calculated based on the assumption that 60% of American adults approve of the president, with the sampling being random and independent.
Can you provide an example of how to calculate the expected value using the given distribution in the script?
-To calculate the expected value, multiply each value of X (0, 1, 2) by its probability of occurrence (0.4, 0.36, 0.24) and sum these products, resulting in an expected value of 1.2.
How would you calculate the expectation of X squared in the example provided?
-To calculate E(X²), square each value of X, multiply by its probability, and sum these products, which in the example results in 1.92.
What is the variance of the random variable X in the example involving American adults' approval of the president?
-The variance, σ², is calculated by taking the expectation of (X - μ)², which in the example is 0.48, based on the provided distribution and probabilities.
Outlines
📚 Introduction to Expectation and Variance of Discrete Random Variables
This paragraph introduces the concepts of expectation and variance for discrete random variables. It explains that the expected value (mean) of a random variable is a theoretical mean based on the distribution, not on sample data, and is represented by the Greek letter mu. The formula for calculating the expected value involves summing the product of each possible value of the variable and its probability. The paragraph also introduces the concept of variance, which measures the average squared distance from the mean, and provides a formula for calculating it. An example is given where the random variable X represents the number of randomly sampled American adults who approve of the president's job performance, with X taking on values 0, 1, or 2.
🔍 Calculating Expectation and Variance: A Practical Example
This paragraph delves deeper into the calculation of expectation and variance using the previously introduced example of American adults' approval of the president's job performance. It outlines the process of finding the mean of the random variable X by multiplying each possible value by its probability and summing these products. The expected value (mean) of X is calculated to be 1.2. The paragraph then explains how to find the expectation of X squared and uses it to calculate the variance of X, which turns out to be 0.48. The standard deviation is also derived from the variance. Additionally, the paragraph verifies the relationship between the expectation of X squared minus the square of the expectation of X, confirming it equals the variance, providing a useful calculation shortcut.
Mindmap
Keywords
💡Expectation
💡Variance
💡Discrete Random Variable
💡Probability Distribution
💡Mean
💡Standard Deviation
💡Function of a Random Variable
💡Theoretical Mean
💡Sample Data
💡Parameter
Highlights
Introduction to expectation and variance of discrete random variables.
Explanation of the difference between the random variable (capital X) and its values (lowercase x).
Meaning of the expected value of a random variable as a theoretical mean, not based on sample data.
Formula for calculating the expected value of a discrete random variable X.
The expected value as a parameter, not a statistic, based on the distribution of the random variable.
Concept of extending expectation to functions of the random variable, such as G(X).
Definition and importance of variance as the average squared distance from the mean.
Formula for calculating the variance of X, involving the expectation of (X - mu) squared.
Variance represented as a parameter, denoted by Sigma squared (Σ²).
Theoretical relationship between the expectation of X squared and (expectation of X) squared.
Practical example involving the approval of the president's job handling by American adults.
Calculation of probabilities for the random variable X based on the given approval percentage.
Method to find the mean of the random variable X using the provided probabilities.
Calculation of the expectation of X squared to further determine the variance.
Process of finding the variance using the difference between the expectation of X squared and (expectation of X) squared.
Verification of the theoretical relationship between variance and the difference of expectations in the example.
Explanation of how to calculate the standard deviation from the variance.
Importance of the relationship between different expectation calculations for practical applications.
Transcripts
Browse More Related Video
Variance and standard deviation of a discrete random variable | AP Statistics | Khan Academy
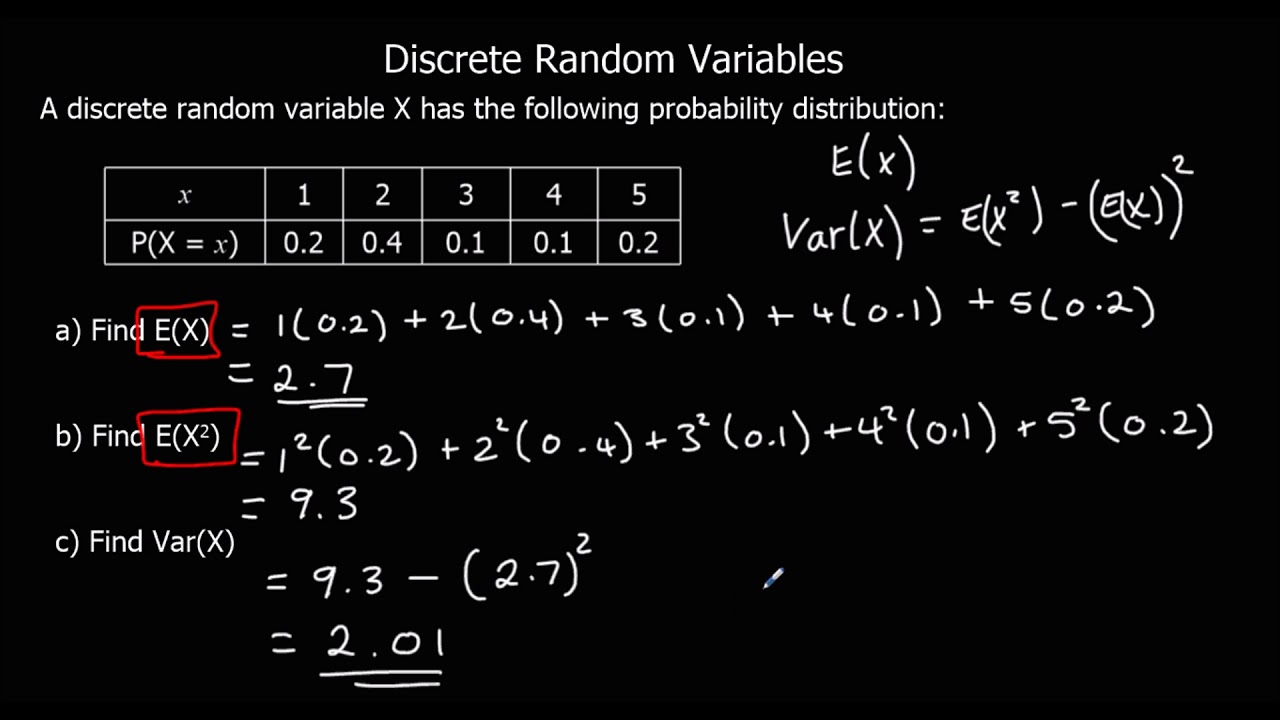
Discrete Random Variables The Expected Value of X and VarX

Elementary Statistics - Chapter 5 Probability Distributions Part 1
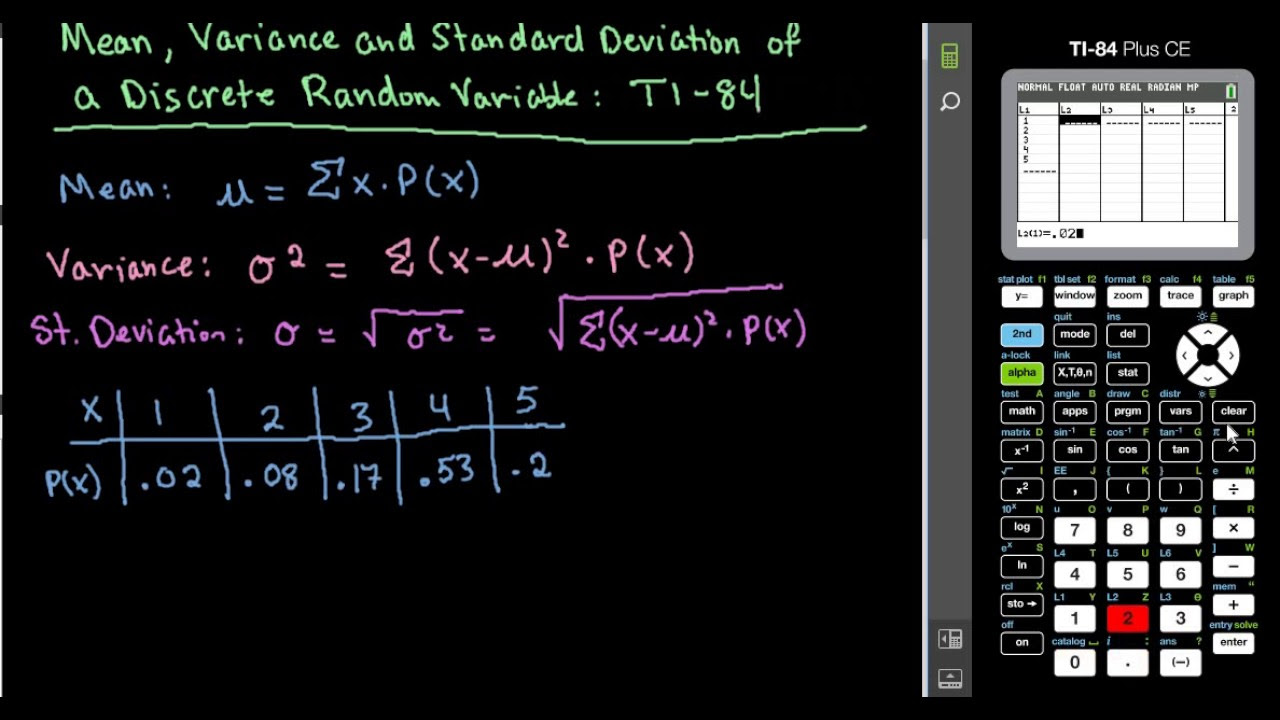
Mean, Variance, and Standard Deviation of Discrete Random Variable-TI-84
Lecture 14: Location, Scale, and LOTUS | Statistics 110

Statistics: Standard deviation | Descriptive statistics | Probability and Statistics | Khan Academy
5.0 / 5 (0 votes)
Thanks for rating: