Sampling Distributions (7.2)
TLDRThis video script delves into the concepts of sample distribution and sampling distribution, emphasizing their differences and significance in statistical analysis. It explains how a sample distribution, derived from a single sample, contrasts with a sampling distribution, which is compiled from multiple random samples. The script also touches on the central limit theorem and illustrates how to calculate probabilities using these distributions, providing practical examples with heights and standard deviations to clarify the concepts.
Takeaways
- 📊 The difference between a sample distribution and a sampling distribution is crucial; a sample distribution is based on a single sample, while a sampling distribution is created from multiple random samples.
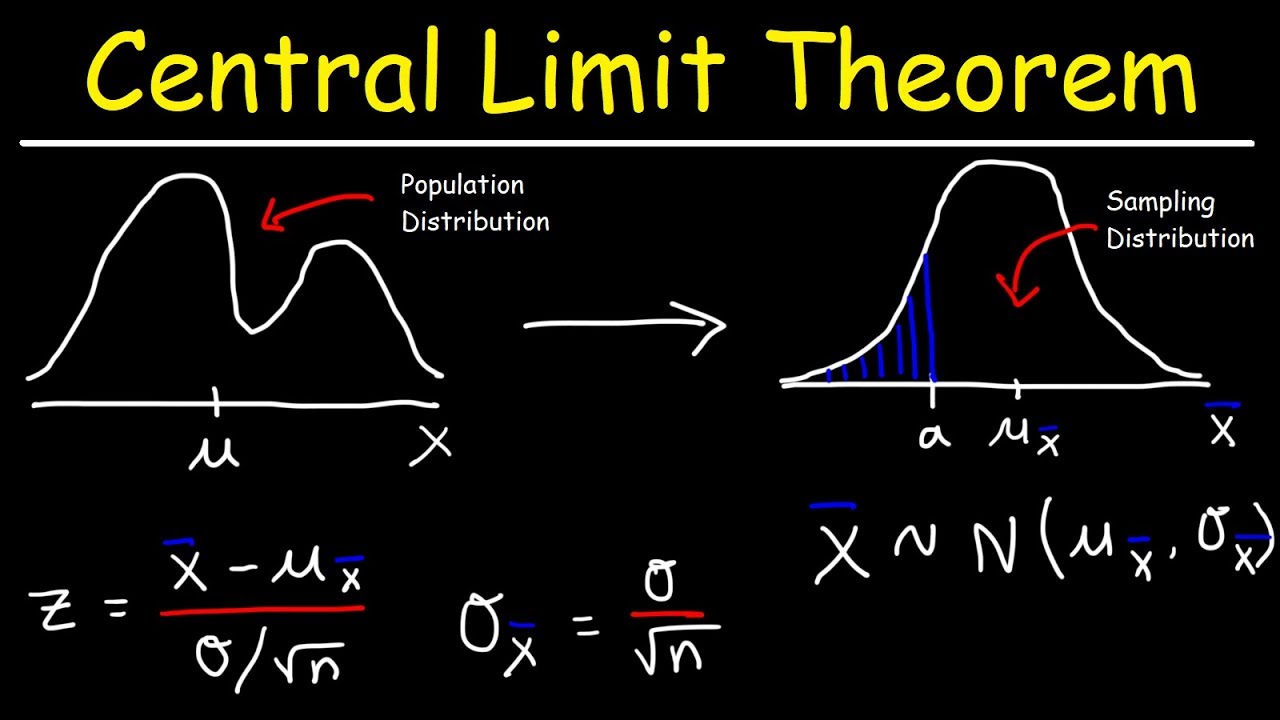
- 🌟 The central limit theorem states that a sampling distribution will be normally distributed if you have enough data, regardless of the original population distribution.
- 📈 A population distribution represents the characteristics of an entire population, with a mean (μ) and standard deviation (σ), whereas a sampling distribution represents the distribution of sample means.
- 🔢 The mean of the sampling distribution is equal to the population mean (μ), showing that the average of all sample means will converge to the true population mean.
- 📐 The standard deviation of the sampling distribution, also known as the standard error, is smaller than the population standard deviation, calculated as σ/√n, reflecting the reduced variability in averages compared to individual observations.
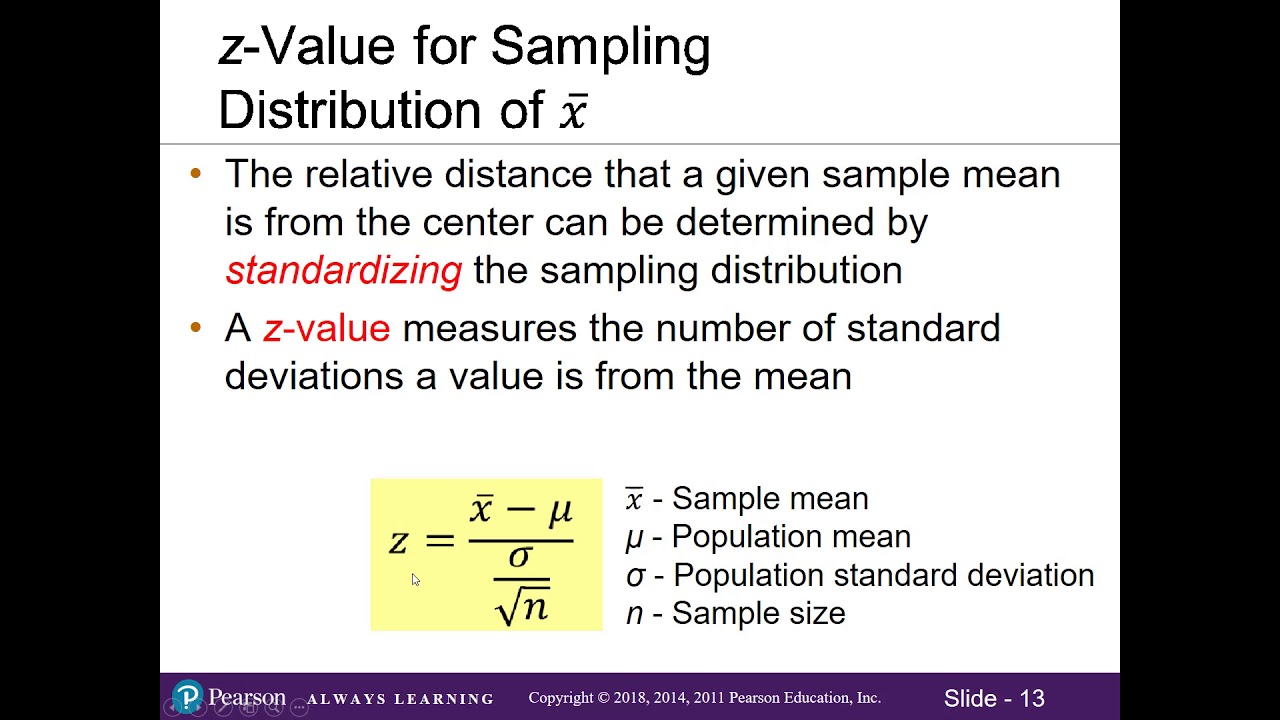
- 🎯 The standardization formula for a normally distributed population is (X - μ)/σ, while for a sampling distribution, it is (X - μ)/σ/√n, accounting for the reduced variability in sample means.
- 🤔 The purpose of a sampling distribution is to provide a convenient and efficient way to estimate population parameters without the need to measure every individual in the population.
- 📝 When calculating probabilities, it's important to distinguish whether you're working with a population distribution or a sampling distribution, as this affects the standardization formula used.
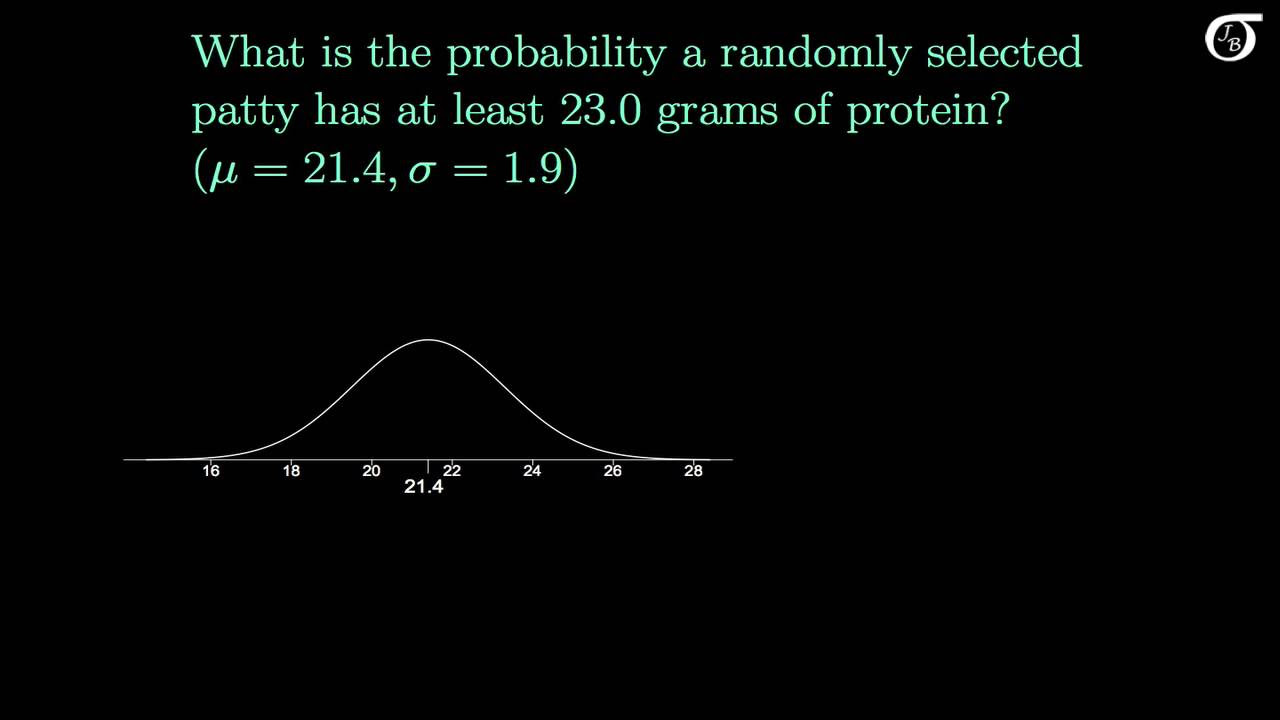
- 📊 To find the probability of a sample mean falling within a certain range, you can use the standardization formula to convert the sample mean into a z-score and then consult a z-score table.
- 🔍 For a given z-score, the z-score table provides the area to the left of that score; to find the area to the right, you can subtract the table value from 1.
- 🌐 The concepts discussed are fundamental to statistical analysis and are widely used in research and data science for making inferences about populations based on sample data.
Q & A
What is the main difference between a sample distribution and a sampling distribution?
-A sample distribution refers to the distribution of a single sample statistic from a population, whereas a sampling distribution is the distribution of a statistic, such as the sample mean, obtained from multiple random samples drawn from a specific population.
Why might the average height from one sample differ from the population mean height?
-The average height from one sample might differ from the population mean height because samples are smaller in size and have more variability. They contain less information and don't always accurately represent the population.
According to the central limit theorem, what will a sampling distribution eventually resemble if enough data is collected?
-According to the central limit theorem, a sampling distribution will eventually resemble a normal distribution, regardless of the shape of the original population distribution, if a large enough number of samples is collected.
What is the standard deviation of a sampling distribution called?
-The standard deviation of a sampling distribution is called the standard error.
How is the standard error calculated for a sampling distribution?
-The standard error is calculated by dividing the population standard deviation (sigma) by the square root of the sample size (n).
Why is creating a sampling distribution more efficient than measuring every individual in a population?
-Creating a sampling distribution is more efficient because it saves time, effort, and resources by not requiring the measurement of every single individual in the population. It allows us to estimate the population mean and calculate probabilities based on a smaller, representative subset of the population.
What is the probability that the average height of 10 random Canadians is less than 157 centimeters, given that the population distribution has a mean of 160 cm and a standard deviation of 7 cm?
-The probability that the average height of 10 random Canadians is less than 157 centimeters is 8.69 percent. This is calculated by finding the z-score for the sample mean of 157 cm, which is -1.36, and then looking up the corresponding area in the standard normal distribution table.
What proportion of the population has heights greater than 170 centimeters, given the same population distribution parameters?
-The proportion of the population with heights greater than 170 centimeters is 7.64 percent. This is found by calculating the z-score for an individual height of 170 cm, which is 1.43, and then finding the area to the right of this z-score in the standard normal distribution table.
How does the spread of a sampling distribution compare to the spread of a population distribution?
-The spread of a sampling distribution, as measured by its standard deviation or standard error, is always smaller than the spread of the population distribution. This is because the sampling distribution is based on averages, which are less variable than individual observations that make up the population distribution.
What is the standardization formula for a normally distributed population with mean mu and standard deviation sigma?
-The standardization formula for a normally distributed population is (observation x - population mean mu) / (population standard deviation sigma).
How does the standardization formula for a sampling distribution differ from that of a population distribution?
-The standardization formula for a sampling distribution is (observation x - population mean mu of all x bars) / (standard deviation, which is sigma divided by the square root of n). Unlike the population distribution formula, it uses the standard error instead of the population standard deviation.
What is the significance of the standard error in the context of a sampling distribution?
-The standard error provides a measure of how much the sample mean is expected to vary from the actual population mean. It is an important concept because it helps in understanding the precision of the sample mean as an estimate for the population mean and in determining the reliability of the sampling distribution.
Outlines
📊 Understanding the Concepts of Sample and Sampling Distributions
This paragraph introduces the fundamental concepts of sample and sampling distributions. It explains the difference between a sample distribution and a sample length distribution, using the example of measuring the average height of a population. The paragraph highlights that a sample, being smaller in size, may not always accurately represent the population due to its inherent variability. It further clarifies the distinction between a sample distribution, which involves interpreting data from a single sample, and a sampling distribution, which is created from multiple random samples drawn from a specific population. The process of creating a sampling distribution is outlined, emphasizing the importance of the central limit theorem in achieving a normal distribution shape.
🧐 Purpose and Application of Sampling Distributions
The second paragraph delves into the practical applications and benefits of sampling distributions. It illustrates the impracticality and inefficiency of measuring every individual in a large population, such as the entire world population, and contrasts this with the convenience of creating a sampling distribution. The paragraph also introduces the concept of standard error and explains how the standard deviation of a sampling distribution is related to the size of the sample. It provides a clear example of calculating the probability of a certain outcome based on sample size, using the heights of Canadians as a case study. The process of standardizing the distribution and using z-scores to find probabilities is detailed, highlighting the utility of sampling distributions in statistical analysis.
📈 Comparing Population and Sampling Distributions with Examples
This paragraph compares population and sampling distributions, focusing on their characteristics such as mean and standard deviation. It explains how the mean of the sampling distribution is equal to the population mean, but the standard deviation of the sampling distribution is smaller due to the reduced variability of averages compared to individual observations. The paragraph provides a step-by-step example of calculating the probability of the average height of a sample of Canadians being less than a certain value, using the standardization formula and z-score table. It also addresses a second example, calculating the proportion of the population with heights greater than a specified value, and clarifies the difference between working with a population distribution and a sampling distribution for different types of questions.
Mindmap
Keywords
💡Sample Distribution
💡Sampling Distribution
💡Population Mean (μ)
💡Standard Deviation (σ)
💡Central Limit Theorem
💡Standard Error
💡Z-Score
💡Random Sample
💡Probability
💡Efficiency and Convenience
Highlights
The video discusses the concept of sampling distribution and how it differs from a sample length distribution.
A sample is a small portion of the population examined to draw conclusions, which may not always accurately represent the population due to its smaller size and variability.
The difference between a sample distribution and a sampling distribution is clarified, with the former involving a single sample and the latter involving multiple samples from a population.
The process of creating a sampling distribution of the sample mean involves taking multiple random samples, calculating the mean height for each, and plotting these values.
A sampling distribution will be normally distributed if enough data is collected, as stated by the central limit theorem.
The population distribution has a mean (mu) and standard deviation (sigma), and a normally distributed random variable x can be represented with these parameters.
The mean of the sampling distribution is equal to the mean of the original population distribution, while its standard deviation is smaller, known as the standard error.
The standard deviation of a sampling distribution is calculated as the population standard deviation divided by the square root of the sample size (n).
The video provides a practical application of sampling distributions, highlighting their use in estimating population parameters without measuring every individual.
The sampling distribution allows for the calculation of the probability of certain outcomes based on sample size (n).
The video presents a practice question involving the heights of Canadians and demonstrates how to calculate the probability of the average height of a sample falling within a certain range.
The process of standardizing the distribution and using z-scores to find probabilities is explained with a clear example.
A comparison is made between the population distribution and the sampling distribution, emphasizing the differences in spread and standard deviation.
The video concludes with a summary that reiterates the importance and utility of sampling distributions in statistical analysis and research.
The central limit theorem and its implications for the shape of the sampling distribution are discussed, providing a theoretical foundation for the concepts presented.
The standardization formula for both population and sampling distributions is introduced, offering a method for calculating probabilities based on these distributions.
The video encourages supporting the creators for more educational content, promoting the sharing of knowledge and resources.
Transcripts
Browse More Related Video
7.2 Sampling Distribution of the Mean (Updated)
Central Limit Theorem - Sampling Distribution of Sample Means - Stats & Probability
The Sampling Distribution of the Sample Mean

Lecture 5: Law of Large Numbers & Central Limit Theorem

Elementary Stats Lesson #13

Sampling distribution of the sample mean 2 | Probability and Statistics | Khan Academy
5.0 / 5 (0 votes)
Thanks for rating: