Ordinary Least Squares Regression
TLDRThe video script introduces ordinary least-squares (OLS) regression, a fundamental statistical method for modeling relationships between variables. It explains the concept using the example of milk price and quantity, illustrating how OLS fits a linear curve to data points to minimize the sum of squared errors. The script also delves into the mathematical formulation of OLS, including the derivation of coefficients and the relationship between total, explained, and residual sum of squares. The significance of R-squared as a measure of explained variation is highlighted, emphasizing its importance in interpreting the effectiveness of the regression model.
Takeaways
- 📊 Ordinary Least-Squares (OLS) regression is a fundamental statistical method used to understand the relationship between a dependent variable and one or more independent variables.
- 🔍 The core idea of OLS is to fit a linear curve (green line in the example) through a set of data points, minimizing the sum of squared errors (differences between observed and predicted values).
- 📉 The downward trend in the example (price of milk vs. quantity bought) illustrates that as price increases, the quantity demanded typically decreases.
- 🎯 The process of OLS involves finding the best-fit line by quantifying the 'error' for each data point and penalizing larger errors more heavily due to the squaring of differences.
- 🧮 The mathematical formulation of OLS involves setting up a system of equations based on the data points and using matrix algebra to find the coefficients (betas) that define the line.
- 🌟 The error terms (epsilons) are used to represent the difference between the actual and predicted values, and they are central to the OLS calculation.
- 📐 The formula for the slope (beta 1) in the OLS regression line is derived from the sum of the product of the independent variable and the dependent variable, minus the product of their means.
- 🏆 The OLS method specifically minimizes the sum of squared errors, which is different from other strategies that might minimize absolute errors or other metrics.
- 🔄 The script explains that SST (Total Sum of Squares) equals SSE (Residual Sum of Squares) plus SSR (Explained Sum of Squares) in OLS, which is a unique property of this regression method.
- 💡 R-squared, a measure of how well the model fits the data, is calculated as 1 - (SSE / SST) in OLS, representing the proportion of variance for the dependent variable that's explained by the independent variables.
- 🚀 The script concludes by noting that future videos will cover other types of regression, such as Ridge, Lasso, and Logistic regression, expanding on the foundational concepts introduced in the OLS discussion.
Q & A
What is the main focus of the video?
-The video focuses on explaining the concept of ordinary least-squares (OLS) regression, which is a fundamental type of regression analysis used to model the relationship between a response variable and an explanatory variable.
What is the basic idea behind ordinary least-squares regression?
-The basic idea behind ordinary least-squares regression is to fit a linear curve, or line, through a set of data points in such a way that the sum of the squared differences (errors) between the actual data points and the fitted line is minimized.
How does the video illustrate the concept of OLS regression?
-The video uses the example of the price of milk versus the quantity of milk purchased to illustrate the concept of OLS regression. It shows a graph with data points and explains how the linear line is fitted to these points to minimize the sum of squared errors.
What is the significance of minimizing the sum of squared errors in OLS?
-Minimizing the sum of squared errors ensures that the fitted line is as close as possible to the actual data points on average. The smaller the sum of squared errors, the better the fit of the model to the data, indicating a more accurate representation of the relationship between the variables.
What is the role of the coefficients in OLS regression?
-The coefficients in OLS regression, namely the slope (beta 1) and the intercept (beta 0), are the parameters that define the best-fit line. They are calculated in such a way that the sum of squared errors is minimized, providing the optimal relationship between the response and explanatory variables.
How does the video explain the calculation of the error term in OLS regression?
-The video explains that the error term in OLS regression is the difference between the actual value of the response variable and the predicted value from the regression line for a given value of the explanatory variable. This error is then squared, and the process is repeated for each data point. The sum of these squared errors is what we aim to minimize.
What is the mathematical representation of the OLS regression model presented in the video?
-The mathematical representation of the OLS regression model presented in the video is given by the system of equations: Q1 = beta naught + beta 1 * P1 + epsilon sub I, ..., Qn = beta naught + beta 1 * Pn + epsilon sub n, where Q1 to Qn are the observed values of the response variable, P1 to Pn are the values of the explanatory variable, beta naught and beta 1 are the coefficients to be determined, and epsilon sub I to epsilon sub n are the error terms.
How does the video describe the process of finding the best-fit line in OLS regression?
-The video describes the process of finding the best-fit line in OLS regression by minimizing the sum of squared errors. This involves setting up a system of equations based on the data points, representing these in matrix form, and then using calculus to find the coefficients (beta naught and beta 1) that minimize this sum.
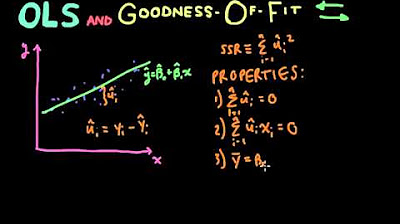
What is the relationship between the sum of squared total (SST), the sum of squared explained (SSR), and the sum of squared residual (SSE) in OLS regression?
-In OLS regression, the sum of squared total (SST) is equal to the sum of squared explained (SSR) plus the sum of squared residual (SSE). This relationship holds because the total variation in the data can be partitioned into the variation explained by the model and the variation that remains unexplained (residual).
How does the video connect the concept of OLS regression to the R-squared measure?
-The video connects the concept of OLS regression to the R-squared measure by explaining that R-squared, which is 1 minus the ratio of SSE to SST, can be interpreted as the percentage of total variation in the response variable that is explained by the model. In the case of OLS regression, R-squared exactly represents this percentage, making it a useful measure for assessing the goodness of fit of the model.
What other types of regression are mentioned in the video as future topics?
-The video mentions that future topics will include Ridge regression, Lasso regression, Logistic regression, and possibly a few others, indicating that OLS regression is just one of many regression techniques available for statistical analysis.
Outlines
📊 Introduction to Ordinary Least-Squares Regression
This paragraph introduces the concept of ordinary least-squares (OLS) regression, which is considered the most fundamental type of regression analysis. It explains the basic idea behind OLS, which is to fit a linear line through a set of data points that best represents the relationship between two variables. The video uses the example of the price of milk and the quantity purchased to illustrate how OLS works. It emphasizes that OLS is linear and seeks to minimize the sum of the squares of the errors between the actual data points and the fitted line. The explanation includes a visual representation of the data points and the process of fitting the line to minimize the error, highlighting the importance of a quantitative approach to determining the best fit.
🧮 Mathematical Formulation of OLS Regression
This paragraph delves into the mathematical formulation of OLS regression. It explains how to represent the relationship between the dependent variable (quantity of milk) and the independent variable (price of milk) using a system of equations. The paragraph introduces the concept of beta coefficients (intercept and slope) and how they are used to create a prediction function for each data point. It also discusses the process of minimizing the sum of square errors through matrix multiplication and vector form, leading to the calculation of the beta coefficients. The explanation includes a step-by-step breakdown of the calculations and the rationale behind each step, providing a clear understanding of the mathematical underpinnings of OLS regression.
🔢 Derivation of Beta Coefficients in OLS
This paragraph focuses on the derivation of the beta coefficients in OLS regression. It explains how to find the values of beta naught (intercept) and beta 1 (slope) that minimize the sum of square errors. The paragraph outlines the process of taking partial derivatives of the error function with respect to the beta coefficients and solving the resulting system of equations. The explanation includes the calculation of the mean of the dependent and independent variables and how they are used in the formulas for the beta coefficients. The paragraph also introduces the notation OLS to indicate that these formulas are specific to the ordinary least-squares regression method.
📈 Relationship between SST, SSE, and SSR in OLS
This paragraph discusses the relationship between the total sum of squares (SST), the explained sum of squares (SSR), and the residual sum of squares (SSE) in the context of OLS regression. It explains how these metrics relate to the variation in the data and the ability of the regression model to explain this variation. The paragraph provides a detailed explanation of how SST is equal to the sum of SSR and SSE in OLS, which is not necessarily true for other types of regression. It also connects this relationship to the R-squared metric, showing that in OLS, R-squared represents the percentage of the total variation in the dependent variable that can be explained by the model. This insight is crucial for interpreting the effectiveness of the regression model in explaining the data.
Mindmap
Keywords
💡Ordinary Least-Squares Regression
💡Explanatory Variable
💡Response Variable
💡Linear Relationship
💡Sum of Squared Errors
💡Coefficients
💡Matrix Form
💡Partial Derivative
💡R-Squared
💡SST, SSE, and SSR
💡Optimization
Highlights
Introduction to ordinary least-squares regression as the fundamental type of regression analysis.
Explanation of the basic concept of using an explanatory variable to explain the response variable through a linear relationship.
Discussion on fitting a linear curve through data points to find the best fit line using ordinary least-squares method.
Quantitative approach to determine the best fit line by minimizing the sum of squared errors.
Description of the error calculation and how it is squared to penalize larger deviations in the prediction.
Introduction to the system of equations that form the basis of the ordinary least-squares regression.
Explanation of representing the system of equations in vector and matrix form for compactness and ease of computation.
Derivation of the formulas for the coefficients (beta naught and beta one) in ordinary least-squares regression.
Use of calculus for minimizing the sum of squared errors to find the best fit coefficients.
Explanation of the partial derivatives taken with respect to beta naught and beta one to find the minimum of the error function.
Presentation of the final equations for beta naught and beta one in the context of ordinary least-squares regression.
Discussion on the interpretation of R-squared as a measure of explained variation in the context of ordinary least-squares regression.
Explanation of the relationship between total sum of squares (SST), explained sum of squares (SSR), and residual sum of squares (SSE) in ordinary least-squares.
Proof that SST equals SSR plus SSE in ordinary least-squares, which is not necessarily true for other regression methods.
Clarification that in ordinary least-squares, R-squared represents the percentage of total variation in the Y values that can be explained by the model.
Introduction to the concept of OLS (Ordinary Least Squares) coefficients and their significance in regression analysis.
Explanation of how the OLS coefficients are derived and their role in minimizing the sum of squared errors.
Discussion on the importance of the OLS method in understanding and applying various types of regression analysis.
Transcripts
Browse More Related Video
Econometrics // Lecture 3: OLS and Goodness-Of-Fit (R-Squared)

Introduction To Ordinary Least Squares With Examples

Econometrics // Lecture 2: "Simple Linear Regression" (SLR)
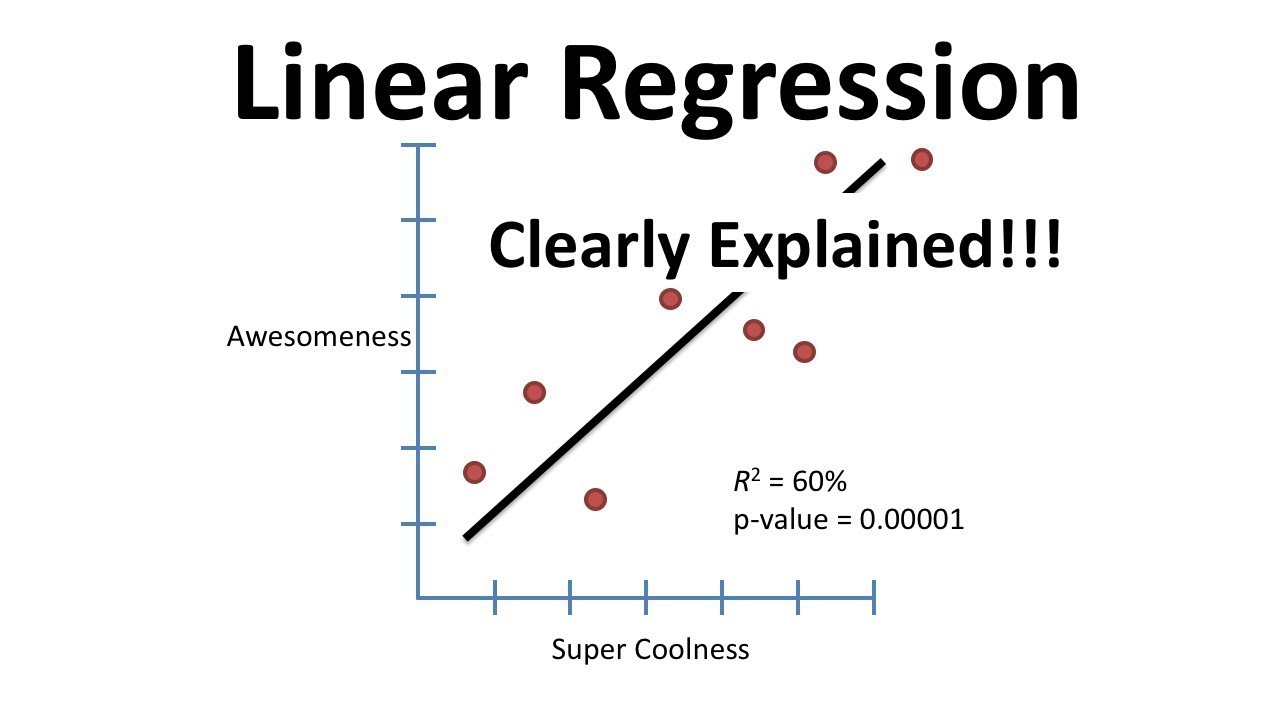
Linear Regression, Clearly Explained!!!
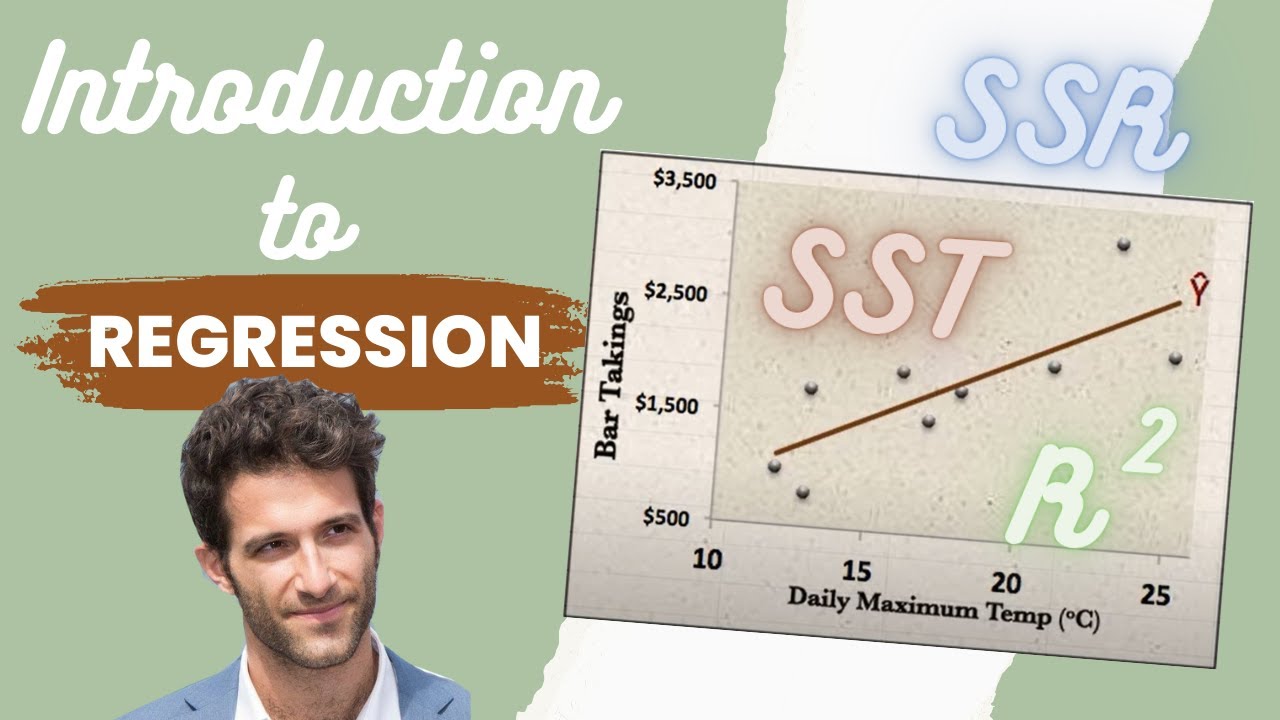
Introduction to REGRESSION! | SSE, SSR, SST | R-squared | Errors (ε vs. e)

Linear Regression, Clearly Explained!!!
5.0 / 5 (0 votes)
Thanks for rating: