Econometrics // Lecture 3: OLS and Goodness-Of-Fit (R-Squared)
TLDRIn this informative lecture, Chris from K's Academy delves into the Ordinary Least Squares (OLS) method and the concept of goodness of fit, measured by R-squared. He explains how OLS estimates the regression line by minimizing the sum of squared residuals, and emphasizes the importance of understanding the properties of OLS for accurate model estimation. The lecture also clarifies the difference between the explained sum of squares (SSE), the total sum of squares (SST), and how R-squared is calculated as a measure of how well the model fits the data. Chris warns against misinterpreting R-squared as indicative of a causal relationship, rounding off the session with an encouragement for feedback and further discussion.
Takeaways
- 📈 The lecture focuses on Ordinary Least Squares (OLS) method and the concept of goodness of fit, measured by R-squared.
- 🔍 In regression analysis, the goal is to understand how changes in the independent variable (X) affect the dependent variable (Y).
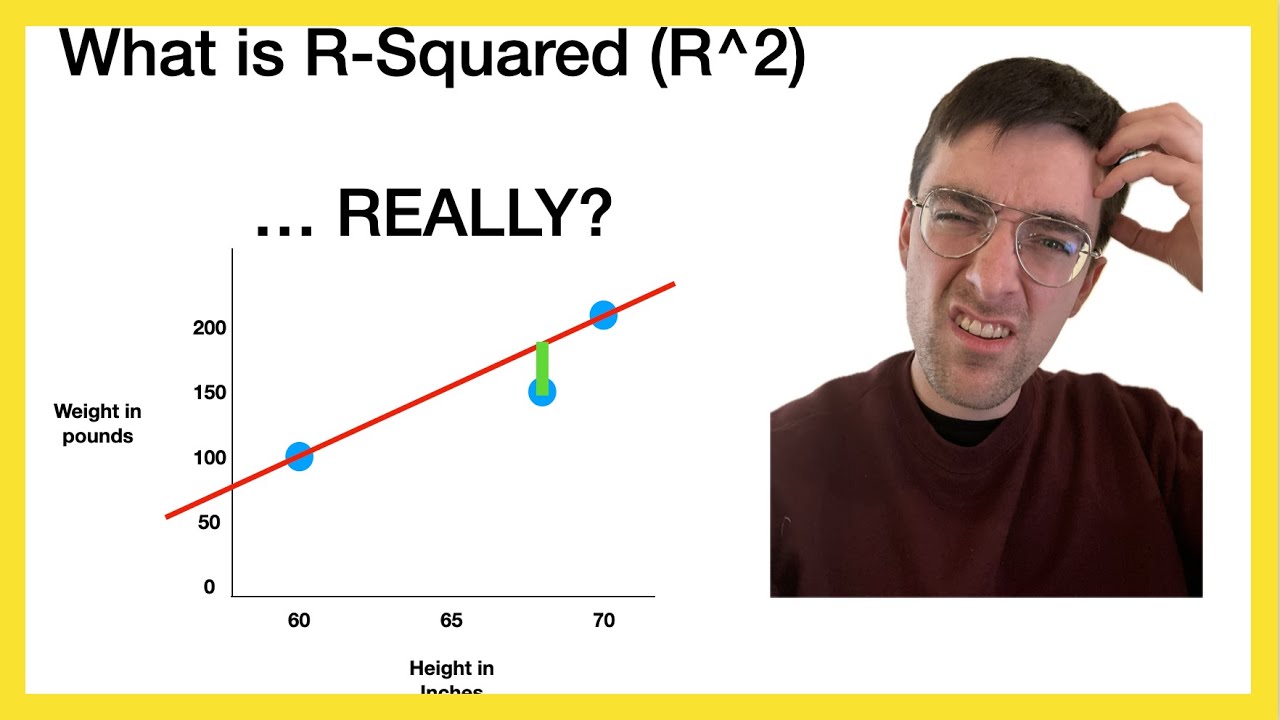
- 📊 OLS aims to find the best-fit line (Y-hat) by minimizing the sum of squared residuals, which is the vertical distance between observed data points and the estimated regression line.
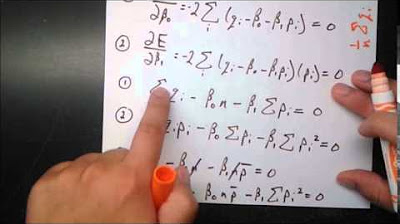
- ✅ The sum of residuals must equal zero, indicating that the observed data points are equally weighted in the regression analysis.
- 🔗 Property 2 of OLS states that the sum of residuals multiplied by the X's should equal zero, implying no correlation between the independent variable and the residuals.
- 🎯 The third property involves the mean of Y (Y-bar) being equal to the estimated intercept (beta-hat 0) plus the estimated slope (beta-hat 1) times the mean of X.
- 📐 Goodness of fit measures, such as R-squared, help to evaluate how well the estimated model fits the true relationship between X and Y.
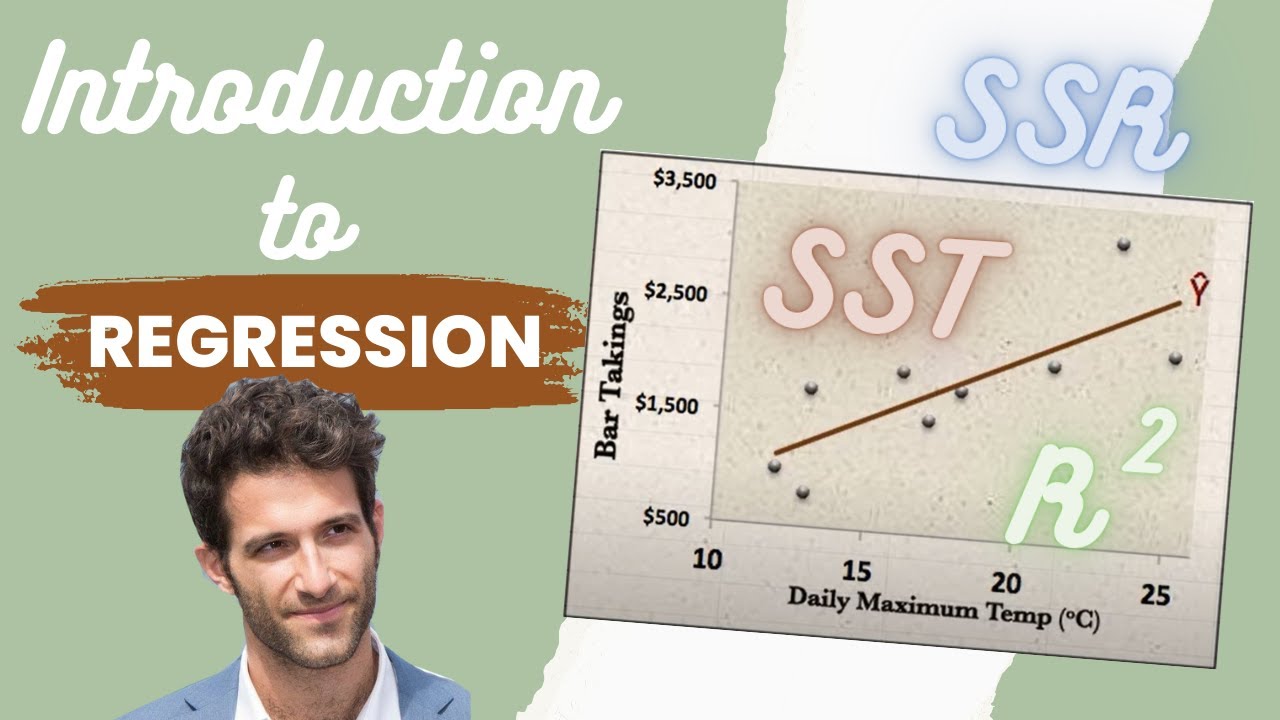
- 🔢 R-squared (R²) is calculated as the Explained Sum of Squares (SSE) divided by the Total Sum of Squares (SST), or equivalently, as 1 minus the ratio of SSR to SST.
- 🚫 R-squared does not indicate a causal relationship; it only measures the proportion of variance in the dependent variable that is predictable from the independent variable.
- 📝 An R-squared value of 1 indicates a perfect fit, where all data points lie on the estimated regression line, while an R-squared value of 0 indicates no correlation between X and Y.
- 💡 A higher R-squared value suggests a better goodness of fit, but it's important to be cautious in interpreting this as indicative of causation.
Q & A
What is the main topic of the lecture?
-The main topic of the lecture is Ordinary Least Squares (OLS) method and the concept of goodness of fit measure, specifically R-squared, in the context of simple linear regression.
What is the purpose of running a regression analysis?
-The purpose of running a regression analysis is to measure how a change in the independent variable (X) affects the dependent variable (Y).
What does the green line in the diagram represent?
-The green line in the diagram represents the estimated regression line, which is the best guess for the relationship between the independent variable (X) and the dependent variable (Y).
How is the OLS method defined in the context of regression analysis?
-The OLS method is defined as a technique for estimating the regression line by minimizing the sum of squared residuals, which are the vertical distances from the regression line to each observed data point.
What is the significance of the property that the sum of residuals must equal zero?
-The property that the sum of residuals must equal zero implies that the observed points are weighted equally above and below the regression line, indicating a balanced distribution of points around the estimated line.
What does the second property of OLS, the sum of residuals multiplied by X's equaling zero, indicate?
-This property indicates that the independent variable (X) is not correlated with the residuals, suggesting that there is no explanation of X in the residual part of the model, which is crucial for the validity of the regression analysis.
What is the meaning of the third property mentioned in the lecture, where Y-bar is equal to beta0-hat plus beta1-hat times the mean of X?
-This property means that at some point on the estimated regression line, the value of the mean of Y (Y-bar) is equal to the estimated intercept (beta0-hat) plus the estimated slope (beta1-hat) times the mean of X. It represents the point on the line where the average values of X and Y intersect.
What is the explained sum of squares (SSE) and how is it calculated?
-The explained sum of squares (SSE) is calculated as the sum of the estimated Y values minus the mean, squared. It tells us how much variation in Y is explained by the regression model.
How is the total sum of squares (SST) defined and what does it represent?
-The total sum of squares (SST) is defined as the sum of the true values of Y minus the mean, squared. It represents all the variation in Y, indicating the total amount of variation in the dependent variable regardless of the model.
How is the R-squared (R2) calculated and what does it represent?
-R-squared (R2) is calculated as the explained sum of squares (SSE) divided by the total sum of squares (SST). It represents the proportion of the variance for the dependent variable that's explained by the independent variables in the regression model.
What is the significance of R-squared in the context of regression analysis?
-The significance of R-squared in regression analysis is that it provides a measure of how well the estimated regression line fits the observed data. A higher R-squared value indicates a better fit, meaning more of the variation in Y is explained by the model, while a lower R-squared value indicates a poorer fit.
What caution should be taken when interpreting R-squared values?
-When interpreting R-squared values, it's important to remember that a high R-squared does not imply a causal relationship between the independent and dependent variables. It simply indicates the extent to which the regression model explains the variation in the dependent variable.
Outlines
📈 Introduction to Simple Linear Regression and OLS
This paragraph introduces the topic of simple linear regression and the ordinary least squares (OLS) method. It explains the concept of how changes in the independent variable (X) affect the dependent variable (Y). The speaker reviews a previously drawn diagram and discusses the observed data points and the estimated regression line (Y-hat). The focus is on defining the regression line in terms of the intercept (beta KN hat) and slope (beta one hat) and emphasizes the goal of minimizing the sum of squared residuals to find the best fit line for the data.
📊 Properties of OLS and Goodness of Fit Measures
In this paragraph, the speaker delves into the properties of OLS and the importance of these properties in ensuring the appropriateness of the regression line. It is highlighted that the sum of residuals must equal zero, indicating equal weighting of points above and below the line. The second property discussed is the independence of the residual from the X variable, which is crucial for valid regression analysis. The paragraph also introduces the concept of the mean of Y (Y-Bar) and its relation to the estimated regression line. The speaker then transitions to discussing goodness of fit measures, specifically the R-squared (R^2), and its interpretation in the context of the explained and total sum of squares (SSE and SST, respectively).
🔍 Interpretation of R-Squared and Cautionary Notes
The final paragraph focuses on the interpretation of the R-squared value as a measure of how well the estimated regression line fits the actual data. It clarifies that an R-squared value of one indicates a perfect fit, while a value of zero suggests no correlation. The speaker warns against misinterpreting a high R-squared value as evidence of a causal relationship, as R-squared only indicates the proportion of variance explained by the model. The lecture concludes with an encouragement for feedback and questions, reinforcing the importance of understanding the concepts discussed.
Mindmap
Keywords
💡Ordinary Least Squares (OLS)
💡Goodness of Fit
💡Residuals
💡Regression Line
💡Intercept (beta zero hat)
💡Slope (beta one hat)
💡Sum of Squared Residuals (SSR)
💡Explained Sum of Squares (SSE)
💡Total Sum of Squares (SST)
💡R-squared (R^2)
💡Causal Relationship
Highlights
Introduction to Ordinary Least Squares (OLS) method in regression analysis.
Explaining the goal of regression analysis: measuring the effect of changes in the independent variable (X) on the dependent variable (Y).
Description of observed data points and the estimated regression line (Y hat) in the context of a diagram.
Definition of the regression line equation with the intercept (beta KN hat) and slope parameter (beta one hat).
Explanation of how OLS aims to find the best fit line by minimizing the sum of squared residuals.
Discussion of the properties of OLS, including the sum of residuals equaling zero and the independence of the independent variable (X) from the residuals.
Clarification of the third property: the mean of Y (Y Bar) being equal to the estimated regression line at the mean of X (X Bar).
Introduction to goodness of fit measures as a way to evaluate the estimated true model.
Definition and explanation of R-squared (R2) as a measure of how well the estimated regression fits the true relationship between X and Y.
Explanation of other variation measures like SSR (sum of squared residuals), SSE (explained sum of squares), and SST (total sum of squares).
Interpretation of R-squared values, where 1 indicates all data points lie on the estimated regression line, and 0 indicates no correlation.
Caution against confusing a high R-squared value with a causal relationship.
Encouragement for viewers to engage with the content by commenting for clarification or feedback.
Overview of the lecture's content and its significance in understanding regression analysis.
The importance of accurately interpreting statistical results to avoid misrepresenting the data.
The role of OLS in providing the best estimate for the relationship between variables in a regression model.
The practical application of OLS in various fields for data analysis and prediction.
Transcripts
Browse More Related Video


5.0 / 5 (0 votes)
Thanks for rating: