2.5 Heating/Cooling Curves (Potential and Kinetic Energy Changes)
TLDRThis educational video explores heating and cooling curves, illustrating the relationship between temperature, time, and heat transfer in substances. It emphasizes the link between temperature and average kinetic energy, highlighting how temperature changes reflect molecular motion. The script explains phase transitions, noting that during melting and boiling, temperature remains constant while potential energy changes due to heat absorption. It contrasts this with periods of temperature change, where kinetic energy varies. The video aims to clarify the molecular processes behind these thermal phenomena.
Takeaways
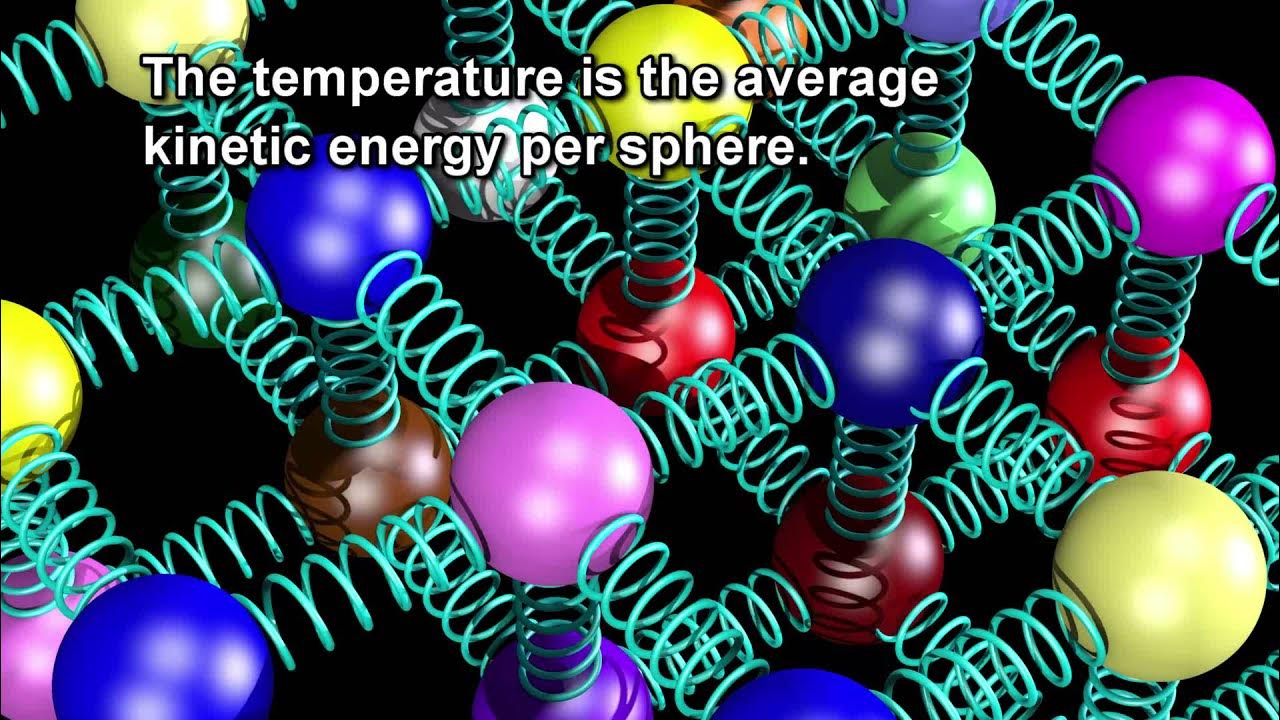
- 🌡️ Temperature is a measure of average kinetic energy, which changes as heat is added or removed.
- 📈 Heating curves plot temperature changes over time or as heat is added, showing how substances transition between states.
- 🧊 As a solid substance is heated, its temperature gradually increases until it reaches its melting point.
- 🔥 During the melting process, even though heat is added, the temperature remains constant, indicating a phase change.
- 💧 The flat line in heating curves represents the phase transition from solid to liquid, where potential energy changes instead of kinetic energy.
- 🌡️ Once a substance is in the liquid phase, further heating increases its temperature, indicating an increase in average kinetic energy.
- 🌡️ The boiling point is another phase transition where the substance changes from liquid to gas, again with a flat line indicating constant temperature.
- 💨 As a gas, increasing temperature means increasing average kinetic energy, with potential energy remaining constant.
- 🧊 Cooling curves mirror heating curves but involve releasing heat, with potential energy decreasing during phase changes.
- ❄️ During cooling, the substance transitions from gas to liquid to solid, with potential energy decreasing as heat is released to the environment.
- 🔍 Understanding the relationship between kinetic and potential energy, and how they change with temperature, is crucial for interpreting heating and cooling curves.
Q & A
What is the main focus of the video script?
-The main focus of the video script is to explain heating and cooling curves, and how they relate to the changes in temperature, kinetic energy, and phase transitions of a substance.
What is the relationship between temperature and kinetic energy?
-Temperature is a measure of average kinetic energy, meaning as temperature increases, so does the average kinetic energy of the molecules in a substance.
What does a flat line on a heating or cooling curve represent?
-A flat line on a heating or cooling curve represents a phase change where the temperature remains constant while energy is added or removed, indicating a change in potential energy rather than kinetic energy.
What happens during the phase change from solid to liquid?
-During the phase change from solid to liquid, the substance absorbs heat without a change in temperature, which is represented by a flat line on the graph. This heat is used to overcome the potential energy holding the solid particles together.
Why does the temperature remain constant during the phase change from liquid to gas?
-The temperature remains constant during the phase change from liquid to gas because the energy being added is used to break the intermolecular bonds, increasing the potential energy, rather than increasing the kinetic energy of the molecules.
What does an increase in temperature signify in terms of kinetic energy?
-An increase in temperature signifies an increase in average kinetic energy, as the molecules in the substance move faster on average.
How does the potential energy of a substance change during a phase change?
-During a phase change, the potential energy of a substance increases as energy is added to change the physical state of the substance, while the average kinetic energy remains constant.
What is the difference between endothermic and exothermic changes in the context of heating and cooling curves?
-Endothermic changes involve the absorption of heat, increasing the internal energy of a substance, while exothermic changes involve the release of heat, decreasing the internal energy.
How does the script explain the relationship between phase changes and energy types?
-The script explains that during phase changes, potential energy changes while average kinetic energy remains constant. In contrast, during periods of temperature change, average kinetic energy changes while potential energy remains constant.
What is the significance of the vapor pressure of a liquid as it is heated?
-The significance of vapor pressure increasing as a liquid is heated is that it indicates the liquid's tendency to evaporate, but this does not change its physical state until the boiling point is reached.
How can the concepts from the script be applied to understand cooling curves?
-The concepts from the script can be applied to cooling curves by understanding that as heat is removed, potential energy decreases during phase changes, and average kinetic energy decreases as temperature drops.
Outlines
🌡 Understanding Heating Curves and Kinetic Energy
This paragraph introduces the concept of heating and cooling curves, which are graphical representations of temperature changes over time or as heat is added to a substance. It emphasizes the relationship between temperature and kinetic energy, stating that temperature is a measure of average kinetic energy. The paragraph explains how heating curves can show the transition of a substance from solid to liquid and then to gas, with flat lines on the graph indicating phase changes where temperature remains constant despite continuous heat input. This is due to the energy being used to change the state of matter, represented by potential energy, rather than increasing kinetic energy.
🔥 Phase Changes and Energy Dynamics
The second paragraph delves deeper into the dynamics of energy during phase changes. It explains that during a phase change, the average kinetic energy remains constant while potential energy increases due to the energy required to break the bonds between particles in the substance. The paragraph contrasts this with periods of temperature increase, where kinetic energy rises and potential energy remains the same. It also discusses the reverse process during cooling, where potential energy decreases as heat is released to the environment, and kinetic energy decreases as the substance cools down. The summary highlights the importance of understanding the molecular scale changes that correspond to macroscopic observations of temperature and phase changes.
Mindmap
Keywords
💡Heating and Cooling Curves
💡Kinetic Energy
💡Phase Changes
💡Melting Point
💡Boiling Point
💡Vapor Pressure
💡Potential Energy
💡Endothermic and Exothermic Processes
💡Molecular Scale
💡Temperature
💡Solid, Liquid, and Gas
Highlights
Heating and cooling curves are graphs that compare temperature to time or heat added to a substance.
Temperature is a measure of average kinetic energy.
As temperature changes, average kinetic energy changes.
During phase changes, temperature remains constant, indicating no change in average kinetic energy.
The flat line in the graph represents the phase change where heat is added but temperature remains constant.
Heat added during phase change is associated with potential energy, not kinetic energy.
The transition from solid to liquid (melting) and from liquid to gas (boiling) occurs at specific temperatures.
The vapor pressure of a liquid increases as temperature rises, but this does not change its state until the boiling point is reached.
In the solid phase, increasing temperature results in increasing average kinetic energy.
During phase change, potential energy increases while average kinetic energy remains constant.
In the gas phase, increasing temperature results in increasing average kinetic energy, with potential energy remaining constant.
Cooling curves involve releasing heat and are similar to heating curves but in reverse.
During cooling, potential energy decreases as heat is released to the environment.
The relationship between kinetic and potential energy changes during phase changes, with kinetic energy remaining constant and potential energy increasing or decreasing.
Understanding the molecular scale changes in kinetic and potential energy is crucial for interpreting heating and cooling curves.
Heat is a form of energy that, when added, increases average kinetic energy, which is measured by temperature.
The shape of the heating and cooling curves provides insights into the phase changes and energy transitions.
Transcripts
Browse More Related Video
Temperature vs Heat - Explained

Latent Heat of Fusion and Vaporization, Specific Heat Capacity & Calorimetry - Physics

Phase Changes | Chemistry | The Good and the Beautiful
Molecular Temperature & Degrees of Freedom
Vapor pressure | States of matter and intermolecular forces | Chemistry | Khan Academy

Heat
5.0 / 5 (0 votes)
Thanks for rating: