Statistics 101: ANOVA Post Hoc Test (Fisher's LSD)
TLDRIn this educational video, Brandon introduces viewers to ANOVA's post hoc analysis, specifically focusing on Fisher's Least Significant Difference (LSD) test. He explains why multiple t-tests are not suitable for comparing more than two population means due to error compounding. Through a practical example of analyzing wait times at Kings Island amusement park, he demonstrates how to use ANOVA to determine if differences exist among group means and then apply Fisher's LSD to pinpoint where those differences occur, providing a clear and engaging explanation of statistical concepts.
Takeaways
- 📚 This video is part of a series on basic statistics, focusing on ANOVA (Analysis of Variance) and its post hoc analysis methods.
- 🔍 ANOVA is used to determine if differences exist among the means of more than two groups, whereas post hoc tests identify where those differences are located.
- 🔑 Post hoc analysis includes multiple comparison tests such as Fisher's LSD, Tukey's HSD, Scheffe's method, and Bonferroni's method, each with different levels of conservativeness.
- 🚫 The script emphasizes the limitations of multiple t-tests for comparing group means, including the compounding of type one error rates.
- 📈 The video introduces a practical example of comparing wait times at three roller coasters in Kings Island amusement park using ANOVA and post hoc analysis.
- 📊 A box plot is recommended for visual representation of data before conducting post hoc tests, providing a preliminary indication of differences between groups.
- 📝 Fisher's LSD test involves calculating a t-statistic to determine the significance of differences between two group means, using the mean square error and degrees of freedom from the ANOVA.
- 📉 The script explains the calculation of the standard error of the difference and the use of t-ratios and p-values to assess the significance of pairwise comparisons.
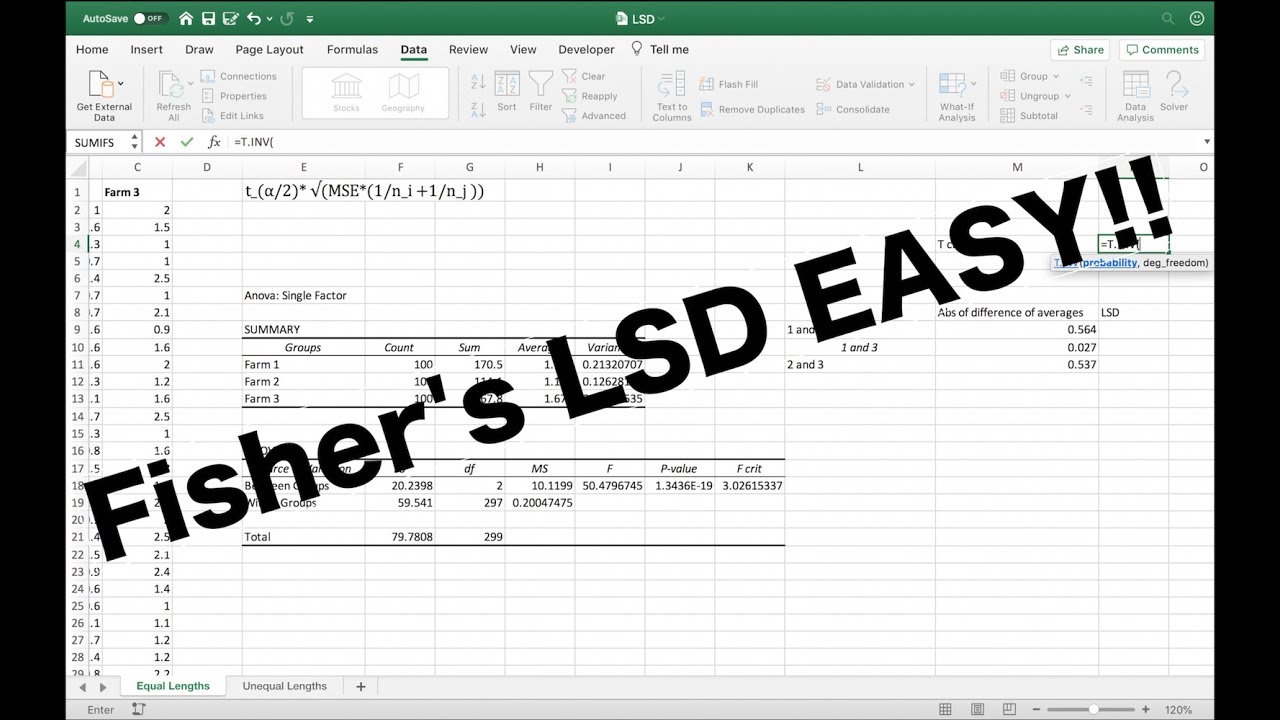
- 📝 An alternative approach to post hoc testing is presented, which involves finding the least significant difference (LSD) threshold to judge if differences are statistically significant.
- 🔢 The video demonstrates the use of Excel functions like T.DIST.2T to find p-values and T.INV.2T to find critical values for hypothesis testing.
- 🔄 The importance of checking results using different methods, such as comparing t-ratios to critical values or calculating the LSD, is highlighted for verification purposes.
Q & A
What is the main topic of the video?
-The main topic of the video is ANOVA post hoc analysis, specifically focusing on Fisher's Least Significant Difference (LSD) test.
What does ANOVA stand for?
-ANOVA stands for Analysis of Variance, a statistical method used to compare the means of more than two groups to determine if there are any significant differences among them.
What is the purpose of post hoc analysis in ANOVA?
-The purpose of post hoc analysis in ANOVA is to determine where the significant differences among group means exist after the overall ANOVA test has indicated that there are differences.
What is Fisher's LSD test used for?
-Fisher's LSD (Least Significant Difference) test is used for post hoc analysis to compare each pair of group means to find out which pairs are significantly different from each other.
What are some other post hoc tests mentioned in the video?
-Other post hoc tests mentioned in the video include Tukey's HSD (Honestly Significant Difference), Scheffe's method, and Bonferroni method.
Why is it not advisable to use multiple t-tests for comparing group means instead of ANOVA?
-Using multiple t-tests for comparing group means instead of ANOVA is not advisable because it compounds the type one error rate with each test conducted, leading to an increased risk of false positives.
What is the main issue with conducting multiple t-tests at an alpha level of 0.05?
-The main issue with conducting multiple t-tests at an alpha level of 0.05 is that the error rate compounds, leading to a higher overall alpha level than intended, which increases the chance of a type one error.
What is the example scenario used in the video to illustrate the concept of ANOVA post hoc analysis?
-The example scenario used in the video is coaster wait times at Kings Island amusement park, where the analyst is trying to determine if there is a difference in wait times between three roller coasters: The Beast, Banshee, and Diamondback.
What is the significance of the mean square error in the context of Fisher's LSD test?
-In the context of Fisher's LSD test, the mean square error is used in the calculation of the standard error of the difference between two group means, which is part of the denominator in the t-statistic formula.
How does the video demonstrate the calculation of the t-statistic for Fisher's LSD test?
-The video demonstrates the calculation of the t-statistic for Fisher's LSD test by showing the formula and then applying it to the example data of roller coaster wait times, including the calculation of the standard error and degrees of freedom.
What is the conclusion of the video regarding the roller coaster wait times?
-The conclusion of the video is that all three pairwise comparisons of roller coaster wait times at Kings Island are significantly different from each other, meaning no two coasters have equal average wait times.
Outlines
📚 Introduction to ANOVA and Post Hoc Analysis
Brandon introduces the video series on basic statistics, focusing on ANOVA (Analysis of Variance) and its advanced concepts. He explains the purpose of ANOVA in comparing means of more than two populations and the limitations of multiple t-tests, which include increased type one error rates due to compounded errors. The video aims to explore post hoc analysis methods, starting with Fisher's Least Significant Difference (LSD) test, among others like Tukey, Scheffe, and Bonferroni tests, to determine where differences among group means exist after a significant ANOVA result.
🎢 Coaster Wait Times: A Practical ANOVA Example
The script presents a real-world example of applying ANOVA to analyze wait times at Kings Island amusement park's roller coasters: The Beast, Banshee, and Diamondback. It details the process of conducting a one-way ANOVA to determine if there's a significant difference in wait times among the three rides. The example uses 25 random riders' wait times for each coaster, resulting in a significant F-test, indicating that not all mean wait times are equal. The video then sets up the need for post hoc analysis to pinpoint exactly where these differences lie.
📊 Understanding Pairwise Comparisons and Visual Data Representation
This paragraph delves into the concept of pairwise comparisons using a difference matrix to compare each pair of roller coasters. It explains the process of creating a matrix that illustrates the differences in wait times between the coasters and emphasizes the importance of visual data representation through a box plot. The box plot visually confirms the differences between the coasters' wait times, setting the stage for the application of Fisher's LSD test to determine statistical significance.
🔍 Fisher's LSD Test Calculation and Interpretation
The script outlines the steps to perform Fisher's Least Significant Difference (LSD) test, starting with calculating the t-statistic for pairwise comparisons of roller coaster wait times. It explains the formula for the t-statistic, involving the difference in means and the standard error of the difference. The video demonstrates how to use Excel's T.DIST.2T function to find the p-value and interpret the results, concluding that all pairwise comparisons show significant differences in wait times.
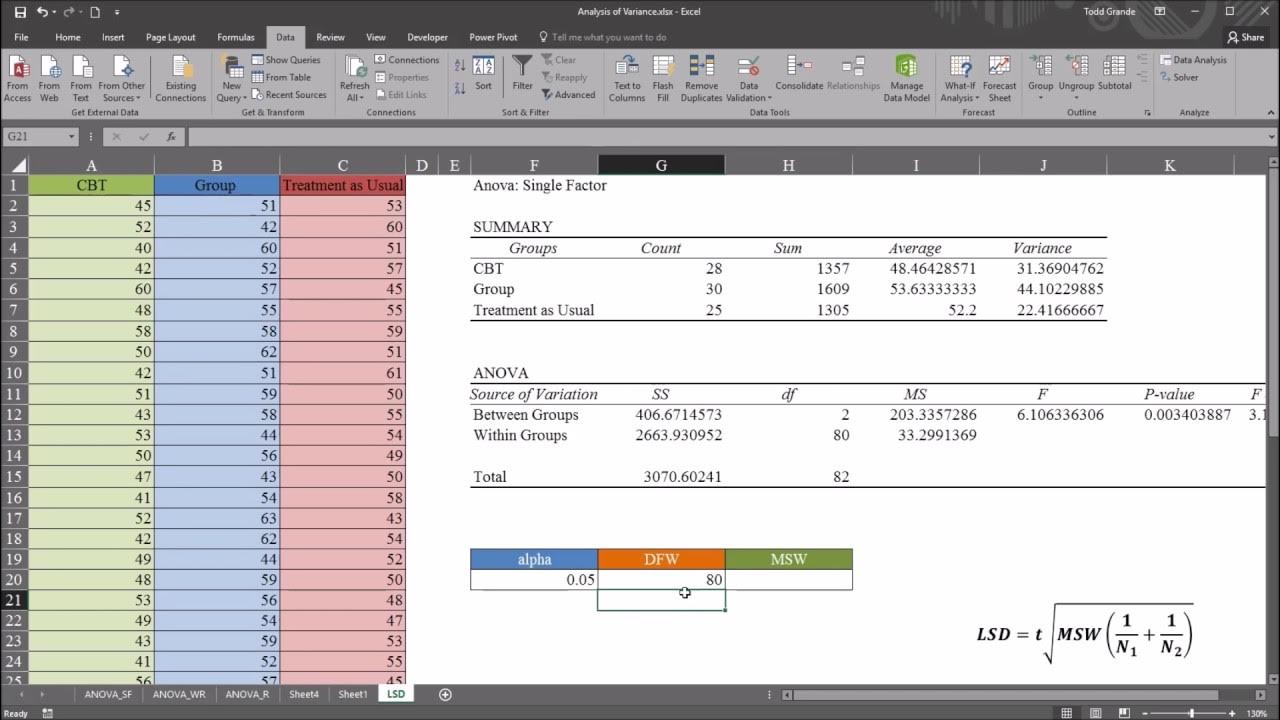
📉 Critical Value Approach and LSD Difference Threshold
The paragraph introduces an alternative method for post hoc analysis using the critical value approach and explains the concept of the LSD difference threshold. It demonstrates how to calculate the critical t-value using Excel and compares it with the calculated t-ratios to determine significance. Additionally, it describes how to calculate the LSD threshold as the minimum difference required for statistical significance, reinforcing the consistency of results between different methods.
🌟 Conclusion on Post Hoc Analysis Techniques
In the final paragraph, the video concludes by summarizing the Fisher's LSD procedure and briefly mentioning other post hoc analysis methods like Tukey's HSD, Scheffe's method, and Bonferroni procedure. It emphasizes the common goal of these methods to identify where differences among group means exist after a significant ANOVA result. The video ends with a reminder to follow recommended guidelines based on textbooks, professors' advice, or data requirements.
Mindmap
Keywords
💡ANOVA
💡Post Hoc Analysis
💡Fisher's LSD
💡Tukey Test
💡Scheffe Test
💡Bonferroni Test
💡Type I Error
💡Confidence Interval
💡Degrees of Freedom
💡P-Value
💡Critical Value
Highlights
Introduction to the video series on basic statistics and the topic of ANOVA (Analysis of Variance).
Explanation of the limitations of one-way ANOVA in identifying specific group differences and the need for post hoc analysis.
Introduction to post hoc analysis, also known as multiple comparisons, and its purpose after ANOVA.
Overview of different post hoc tests including Fisher's LSD, Tukey, Scheffe, and Bonferroni tests.
Fisher's Least Significant Difference (LSD) test focus for the video and its methodology.
The problem with multiple t-tests for pairwise comparisons and the error compounding issue.
ANOVA's advantage over multiple t-tests in handling all sample means simultaneously.
The coaster wait times case study introduction from Kings Island amusement park.
Description of the data collection process for analyzing wait times on three roller coasters.
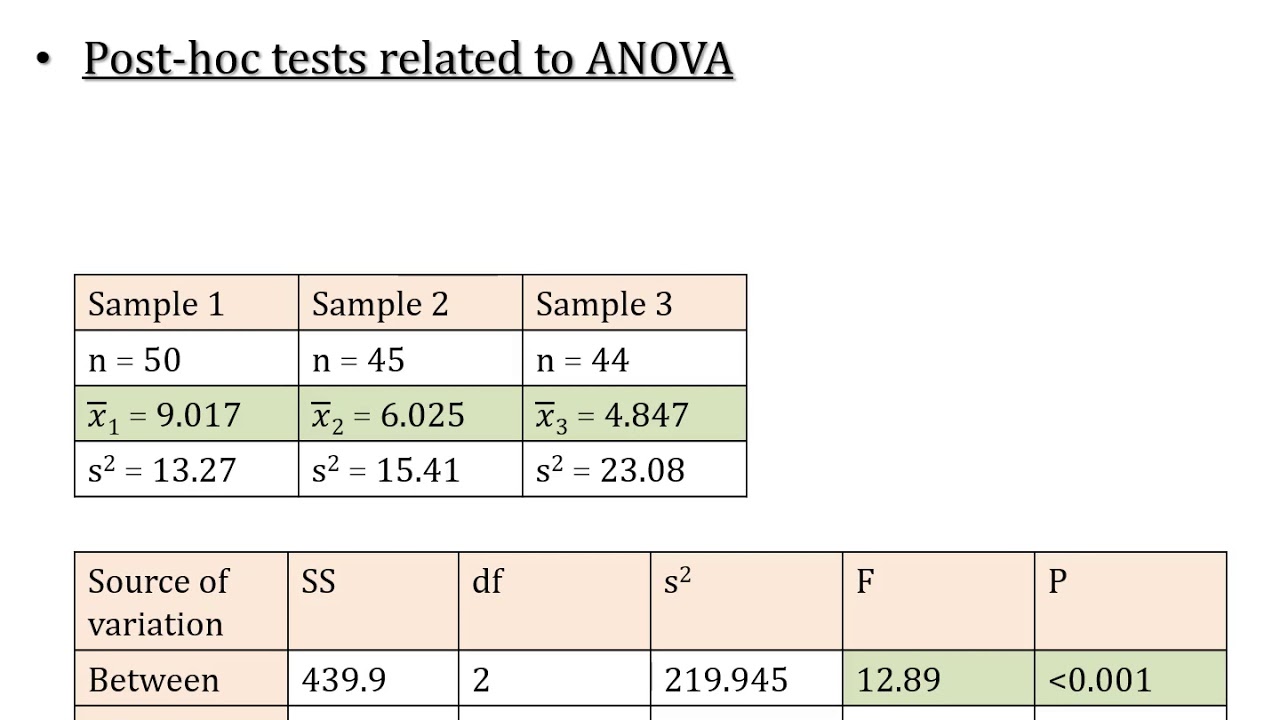
ANOVA results indicating significant differences in wait times among the roller coasters.
Explanation of mean square error and degrees of freedom from the ANOVA results.
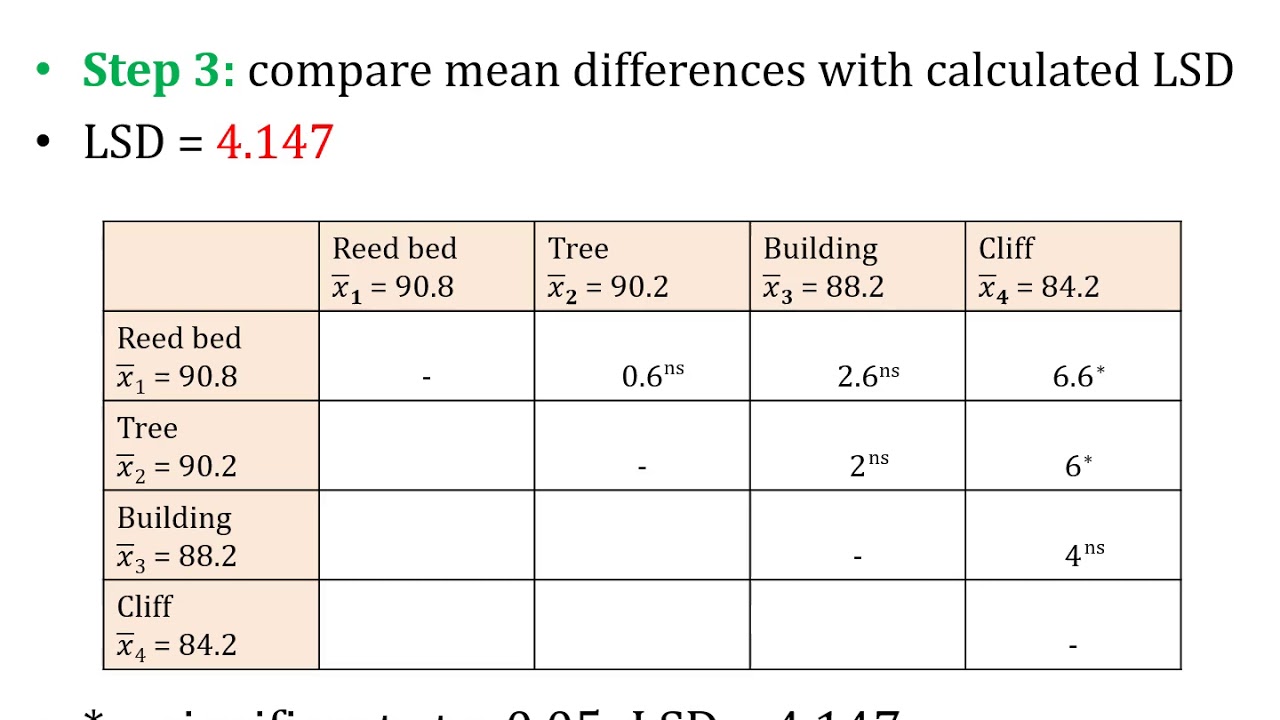
Creation of a difference matrix for pairwise comparison of roller coaster wait times.
Visual representation of the data through a box plot to illustrate differences between coasters.
Calculation of the t-statistic for the Beast versus Banshee using the Fisher LSD procedure.
Interpretation of the t-statistic and its corresponding p-value to determine significance.
Application of the Fisher LSD test to all pairwise comparisons of roller coaster wait times.
Summary of the findings indicating significant differences in wait times between all three roller coasters.
Comparison of different post hoc analysis methods and their appropriateness for various data types.
Conclusion emphasizing the role of post hoc analysis in identifying specific mean differences after ANOVA.
Transcripts
Browse More Related Video
LSD; Least Significant Difference; Post Hoc Test of ANOVA; Comparison of Means (Part A)

Statistics 101: ANOVA Post Hoc in Excel (Fisher's LSD)
LSD; Least Significant Difference; Post Hoc Test of ANOVA; Comparison of Means (Part B)
Fisher's LSD Explained

Understanding Analysis of Variance (ANOVA) including Excel - Statistics Help
One-Way ANOVA with LSD (Least Significant Difference) Post Hoc Test in Excel
5.0 / 5 (0 votes)
Thanks for rating: