Fisher's LSD Explained
TLDRThis video from Stats Coach explains the Fisher's Least Significant Difference (LSD) test, a post-hoc analysis used after ANOVA to determine which specific groups differ significantly. The script covers the LSD formula, its application in Excel for datasets with both equal and unequal group sizes, and how to interpret the results to identify significant differences between group means. It also emphasizes the importance of ANOVA in establishing the presence of at least one differing group before applying LSD for pairwise comparisons.
Takeaways
- 📚 The video explains how to use Fisher's Least Significant Difference (LSD) test in conjunction with ANOVA to determine if specific groups are significantly different from each other.
- 🔍 ANOVA tests if there is a significant difference among three or more groups, but it does not specify which groups are different; LSD helps to identify specific group differences.
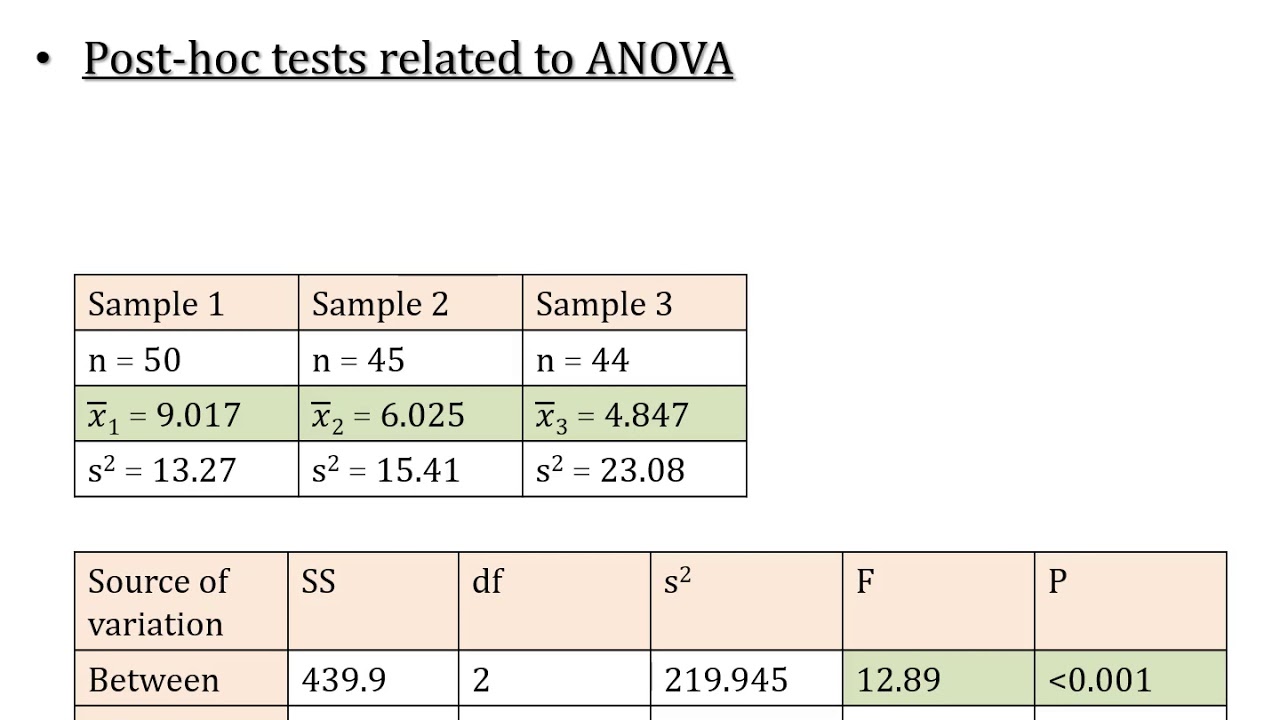
- 📉 The equation for LSD is given as LSD = T_critical * sqrt(MSE * (1/n_I + 1/n_J)), where MSE is the mean square error, and n_I and n_J are the sizes of the two groups being compared.
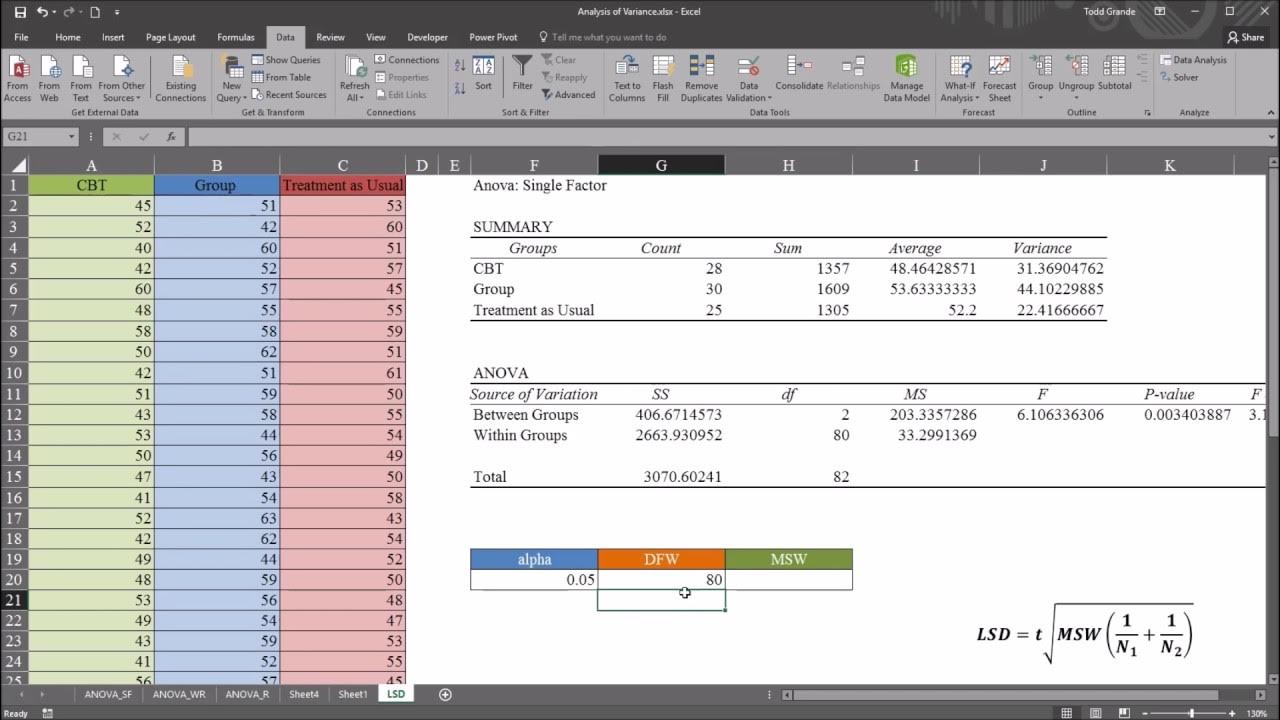
- 📊 To perform LSD in Excel, first run a single-factor ANOVA to determine if there is a significant difference among the groups, then calculate the absolute difference in means and compare it to the LSD value.
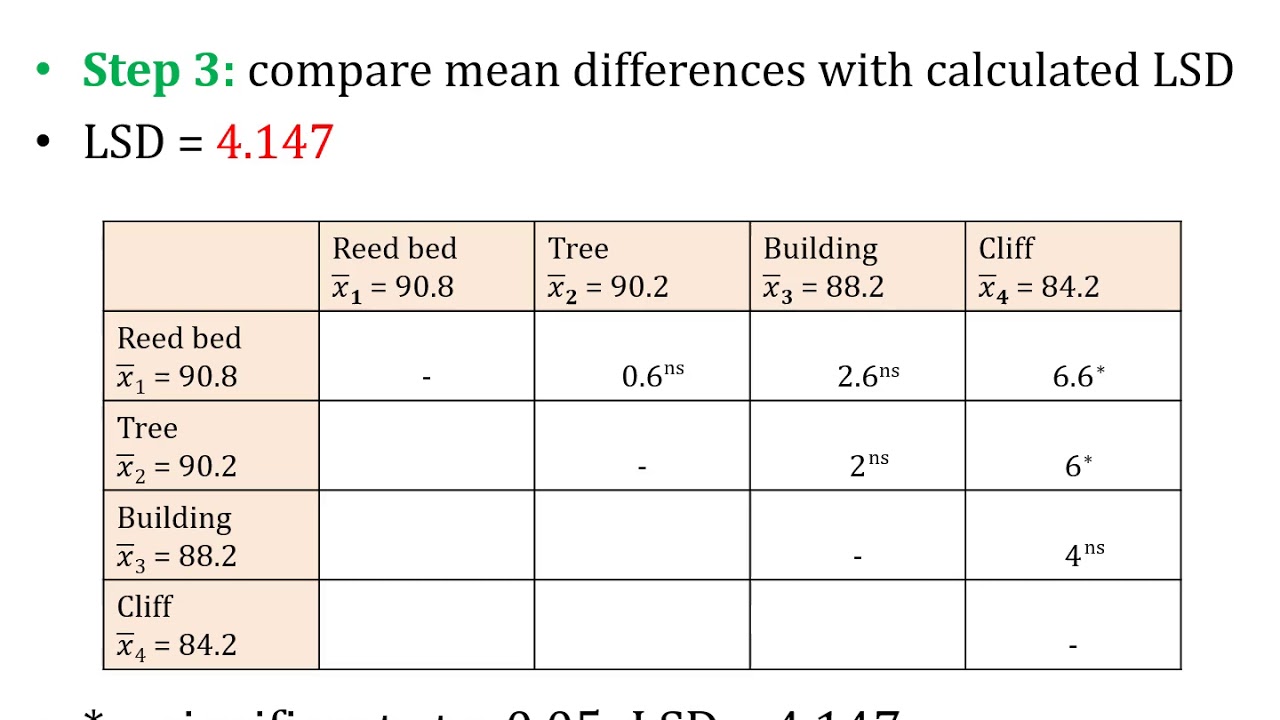
- 🚫 If the absolute difference between the means of two groups is greater than the LSD value, it suggests that the groups are significantly different.
- 📈 The video provides a step-by-step guide on how to calculate the LSD value in Excel, including finding the T_critical value using the T.INV function with alpha/2 and degrees of freedom.
- 🔢 The video demonstrates the process using two datasets: one with equal group sizes (potato weights from different farms) and one with unequal group sizes (fish caught by different boats).
- 📝 When group sizes are equal, the calculation of LSD is simpler as the 1/n_I and 1/n_J terms are the same for all group comparisons.
- 🔄 For unequal group sizes, the LSD value must be recalculated for each group comparison, taking into account the different group sizes.
- 📑 The video script includes a practical example of how to organize data and calculations in an Excel spreadsheet for both equal and unequal group sizes.
- 🔑 The final conclusion drawn from the examples is that Group 2 (farm or boat) is significantly different from the others, indicating a need to investigate its unique characteristics or methods.
Q & A
What is the purpose of using Fisher's Least Significant Difference (LSD) test in conjunction with ANOVA?
-Fisher's LSD test is used with ANOVA to determine which specific groups are different from each other when ANOVA indicates that at least two groups are different. ANOVA only tells us if there is a difference among the groups, but LSD helps identify which pairs of groups are significantly different.
What does it mean to reject or fail to reject in ANOVA?
-In ANOVA, rejecting the null hypothesis means that there is evidence to suggest that at least one group is different from the others. Failing to reject the null hypothesis means there is not enough evidence to conclude that the groups are different.
What is the formula for calculating Fisher's LSD?
-The formula for LSD is: LSD = T_critical value * sqrt(MSE * (1/n_i + 1/n_j)), where MSE is the mean square error, n_i and n_j are the sample sizes of the two groups being compared, and T_critical value is found using the degrees of freedom within the ANOVA analysis and alpha/2.
How is the T_critical value determined in Fisher's LSD test?
-The T_critical value is determined using the T.INV function in Excel or a similar statistical tool, with the input being the degrees of freedom for the within-group variance and the probability of 1 - (alpha/2), where alpha is the significance level.
What is the significance of comparing the absolute value of the difference between group averages to the LSD value?
-The comparison of the absolute value of the difference between group averages to the LSD value helps determine if the difference between the two group means is statistically significant. If the absolute value is greater than the LSD, the null hypothesis is rejected, indicating a significant difference between the groups.
How does the process of using Fisher's LSD differ when sample sizes are equal versus when they are unequal?
-When sample sizes are equal, the calculation of LSD is straightforward as the 1/n_i and 1/n_j terms are the same for all comparisons. However, when sample sizes are unequal, the LSD calculation must be done separately for each pair of groups, as the 1/n_i and 1/n_j terms will differ for each comparison.
What is the role of the p-value in the context of ANOVA?
-The p-value in ANOVA indicates the probability of observing the test statistics under the null hypothesis. If the p-value is smaller than the chosen alpha level (commonly 0.05), the null hypothesis is rejected, suggesting that at least one group is significantly different from the others.
How does the video script illustrate the application of Fisher's LSD in Excel?
-The script provides a step-by-step guide on how to perform Fisher's LSD in Excel, including calculating the absolute value of the difference between group averages, determining the LSD value, and comparing these values to identify significant differences between groups.
What is the importance of the 'eye check' mentioned in the script?
-The 'eye check' refers to a quick visual inspection of the data to identify any obvious differences or patterns. For example, in the script, the average weights of potatoes from farm two are noticeably different from the other farms, which can be a preliminary indication of a significant difference before performing the statistical test.
Can Fisher's LSD test be used to determine the direction of the difference between group means?
-No, Fisher's LSD test does not indicate the direction of the difference (i.e., which group is larger or smaller). It only determines if there is a statistically significant difference between the means of two groups.
What is the implication of rejecting the null hypothesis in a Fisher's LSD test for group comparisons?
-Rejecting the null hypothesis in a Fisher's LSD test for group comparisons implies that there is a statistically significant difference between the two groups being compared, suggesting that they are not the same in terms of the variable being studied.
Outlines
📊 Introduction to LSD in ANOVA Analysis
This paragraph introduces the concept of Fisher's Least Significant Difference (LSD) test, which is used in conjunction with Analysis of Variance (ANOVA). ANOVA helps determine if there are significant differences between three or more groups in a dataset. However, ANOVA only informs us if at least two groups differ, without specifying which ones. LSD is used to test specific pairs of groups to find out if they are significantly different. The equation for LSD is presented, involving a T-critical value, the Mean Squared Error (MSE), and group sizes. The explanation includes a step-by-step guide on how to perform LSD tests in Excel, starting with running an ANOVA to determine if there are differences among groups, calculating the absolute difference between group means, and then comparing these to the calculated LSD value to conclude which groups are significantly different.
🔍 Applying LSD with Equal Group Sizes in Excel
The second paragraph delves into the application of LSD tests using Excel with a dataset featuring three farms producing potatoes. It demonstrates the process of running an ANOVA test to reject the null hypothesis, indicating at least one farm's potato production differs from the others. The paragraph explains calculating the LSD value using the T-critical value, MSE, and the sizes of the groups. It also details how to calculate the absolute difference in averages between pairs of groups and compares these to the LSD value to determine which groups are significantly different. The conclusion is that Farm 2 produces significantly smaller potatoes compared to the other farms, based on the LSD test results.
📉 LSD Test with Unequal Group Sizes and Different Scenarios
This paragraph extends the discussion to scenarios with unequal group sizes, using a fishing example with three boats catching different numbers of fish. It outlines the process of running an ANOVA test and interpreting the results, which show significant differences among the boats' catch sizes. The explanation covers calculating the absolute difference in averages between the boats and the LSD value for each pair, considering the unequal group sizes. The comparison of these values leads to the conclusion that Boat 2 catches significantly larger fish compared to Boats 1 and 3. The paragraph emphasizes the importance of understanding group differences and the potential need to emulate successful techniques, such as those used by Boat 2.
Mindmap
Keywords
💡ANOVA
💡LSD
💡Degrees of Freedom
💡MSE (Mean Square Error)
💡Critical Value
💡Alpha Level
💡Post-hoc Test
💡Excel
💡Reject/Fail to Reject
💡Absolute Value
Highlights
Introduction to Fisher's Least Significant Difference (LSD) test and its use with ANOVA.
Explanation of how ANOVA tests for differences among three or more groups but does not identify which specific groups differ.
Description of LSD as a method to test two specific groups against each other to identify differences.
The LSD formula is presented, involving the T critical value, MSE, and group sizes.
Demonstration of how to perform an ANOVA test in Excel and interpret the results to decide whether to reject or fail to reject the null hypothesis.
Process of calculating the absolute value of the difference between group averages to compare with LSD.
Step-by-step guide on finding the T critical value using Excel functions for LSD calculations.
Excel walkthrough for calculating LSD with equal group sizes, simplifying the process.
Comparison of absolute average differences to LSD to determine if groups are statistically different.
Analysis of a dataset involving three farms and their potato production weights to identify differences.
Use of ANOVA to determine if there are differences among the farms before applying LSD.
Application of LSD to compare farms with unequal group sizes, adjusting calculations accordingly.
Calculation of different LSD values for comparisons between groups with different sizes.
Interpretation of LSD results to identify which groups are statistically different in the context of boat fishing weights.
Practical application of LSD in determining which boat's fishing technique may be more effective based on average catch weight.
Invitation for viewers to comment with questions or feedback on the use of LSD.
Transcripts
Browse More Related Video
LSD; Least Significant Difference; Post Hoc Test of ANOVA; Comparison of Means (Part A)
LSD; Least Significant Difference; Post Hoc Test of ANOVA; Comparison of Means (Part B)
One-Way ANOVA with LSD (Least Significant Difference) Post Hoc Test in Excel

Statistics 101: ANOVA Post Hoc Test (Fisher's LSD)

Statistics 101: ANOVA Post Hoc in Excel (Fisher's LSD)

One-way ANOVA & Post-Hoc Analysis in Excel
5.0 / 5 (0 votes)
Thanks for rating: