Chi-Square Test [Simply explained]
TLDRThis video script offers a straightforward explanation of the chi-square test, a statistical method used to determine if there's a relationship between two categorical variables. It walks through the process of conducting the test using both statistical software and manual calculations, providing a practical example with gender and educational level. The script also explains how to interpret the p-value, highlighting the decision to reject or not reject the null hypothesis based on the significance level.
Takeaways
- 📊 The chi-square test is a statistical method used to determine if there is a relationship between two categorical variables.
- 🔍 Categorical variables include characteristics like gender, preferred newspaper, or educational level, as opposed to continuous variables like weight or salary.
- 🤔 The purpose of the chi-square test is to check for a correlation between two categorical variables, such as whether gender affects the preferred newspaper.
- 📝 To perform a chi-square test, data is collected and arranged in a cross-tabulation table, showing how often each combination of variables occurs.
- 💻 Statistical software like DataTab can be used to calculate the chi-square test and provide a p-value, which helps in interpreting the results.
- 📑 The chi-square test involves comparing observed frequencies from the survey data with expected frequencies under the assumption of independence.
- 📈 The chi-square value is calculated using a formula that compares observed and expected frequencies, squared and divided by the expected frequency.
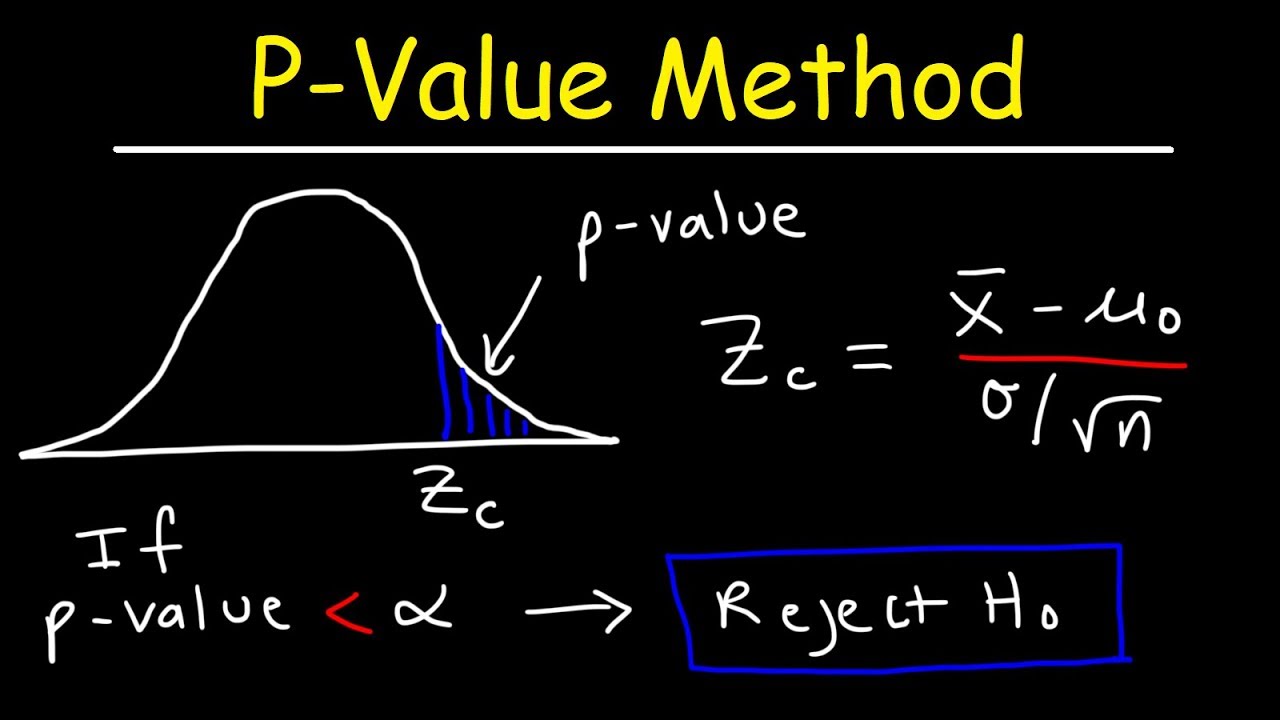
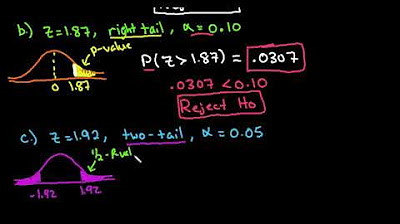
- 🔑 A p-value is used to determine the significance of the results; if the p-value is less than 0.05, the null hypothesis of no relationship is rejected.
- 📚 The script provides a step-by-step guide on how to perform a chi-square test both using online calculators and by hand calculations.
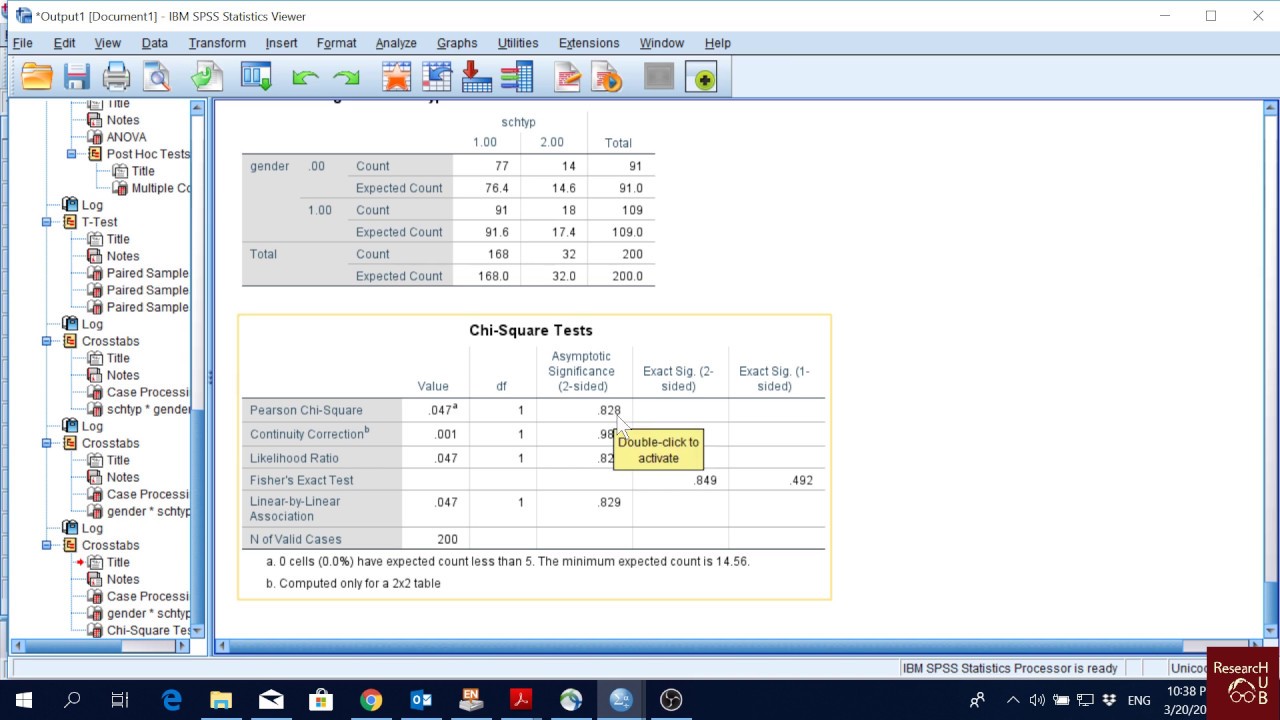
- 📉 The example in the script showed a p-value of 0.92, indicating no significant relationship between gender and the highest level of education.
- 📘 The degrees of freedom for the chi-square test are calculated as (number of rows - 1) * (number of columns - 1), used to find the critical chi-square value.
Q & A
What is the purpose of the chi-square test?
-The chi-square test is a statistical hypothesis test used to determine whether there is a significant relationship between two categorical variables.
What are categorical variables?
-Categorical variables are variables that can be divided into groups or categories without any intrinsic ordering. Examples include gender, preferred newspaper, frequency of television viewing, and the highest educational level of a person.
How does the chi-square test help in analyzing relationships between variables?
-The chi-square test helps by determining if the observed frequencies in a cross-tabulation (or contingency table) are significantly different from what would be expected if there were no relationship between the variables.
What is a cross table or contingency table?
-A cross table or contingency table is a type of table in statistics that displays the frequency distribution of variables in a matrix format, showing the joint distribution of two or more categorical variables.
How can I perform a chi-square test using an online tool?
-You can perform a chi-square test using an online tool like DataTab by visiting datadep.net, clicking on 'Statistics Calculator', and entering your data into the provided table.
What is the significance of the p-value in the chi-square test?
-The p-value in the chi-square test indicates the probability that the observed data (or something more extreme) would occur if the null hypothesis of no relationship between variables is true. A small p-value (typically less than 0.05) suggests that the null hypothesis can be rejected.
What does it mean to 'reject the null hypothesis' in the context of the chi-square test?
-Rejecting the null hypothesis means that there is enough evidence to suggest that there is a relationship between the two categorical variables being tested, and the observed frequencies are significantly different from what would be expected if there were no relationship.
How can I calculate the chi-square test by hand?
-To calculate the chi-square test by hand, you need the observed frequencies from your data and the expected frequencies, which are calculated based on the assumption of independence between variables. You then apply the chi-square formula to each cell of the cross table and sum the results to get the chi-square value.
What is the chi-square formula used to calculate the chi-square value?
-The chi-square formula is (O - E)² / E, where O is the observed frequency and E is the expected frequency for each cell in the cross table.
How do you determine the expected frequencies for the chi-square test?
-Expected frequencies are calculated by assuming that the variables are independent of each other. The formula for expected frequency for a cell is (row total * column total) / grand total.
How do you interpret the chi-square value and the critical chi-square value?
-The chi-square value obtained from the test is compared to a critical chi-square value from a chi-square distribution table. If the calculated chi-square value is less than the critical value, the null hypothesis is not rejected, indicating no significant relationship between the variables.
Outlines
📊 Introduction to the Chi-Square Test
This paragraph introduces the chi-square test, a statistical method used to determine if there is a relationship between two categorical variables. It explains the concept of categorical variables, provides examples, and outlines the scenarios where the chi-square test is applicable. The paragraph also discusses the process of conducting a survey to collect data, which is then organized into an Excel table to facilitate the chi-square test. It describes how to use statistical software like Data Tab to generate a cross table and perform the test, aiming to answer specific questions about relationships between variables.
📘 Calculating the Chi-Square Test and Interpreting Results
The second paragraph delves into the process of calculating the chi-square test both through statistical software and manually. It explains how to obtain expected frequencies for perfectly independent variables and interpret the results of the test, including the significance of the p-value. The paragraph provides a step-by-step guide on using Data Tab's online calculator for chi-square tests, and how to interpret the summary in words provided by the software. It also covers the manual calculation method, including the formula for chi-square value and the process of comparing it with a critical chi-square value to determine the acceptance or rejection of the null hypothesis. The paragraph concludes with a brief mention of additional resources available on Data Tab for further learning.
Mindmap
Keywords
💡Chi-square test
💡Categorical variables
💡Hypothesis test
💡Cross table
💡Observed frequency
💡Expected frequency
💡Statistical significance
💡P-value
💡Degrees of freedom
💡Critical chi-square value
Highlights
The chi-square test is a hypothesis test used to determine if there is a relationship between two categorical variables.
Categorical variables include characteristics like gender, preferred newspaper, and frequency of television viewing.
The chi-square test is used to check for a correlation between two categorical variables, such as gender and preferred newspaper.
A questionnaire can be used to collect data on gender and the highest level of education for chi-square test analysis.
Data can be organized in an Excel table to visualize the relationship between categorical variables.
Statistical software like Data Tab can be used to perform a chi-square test and generate a cross table.
The cross table shows the frequency of each combination of categorical variables, such as gender and highest educational level.
The chi-square test formula involves comparing observed frequencies to expected frequencies for independence.
Data Tab automatically suggests the appropriate test, such as the chi-square test, based on the input data.
A p-value is provided by statistical software to determine the significance of the relationship between variables.
A p-value greater than 0.05 indicates no statistically significant relationship between the variables.
The chi-square test can be calculated by hand using the observed and expected frequencies with the chi-square formula.
Expected frequencies are calculated based on the assumption of no relationship between the variables.
The chi-square value is calculated by summing the squared differences between observed and expected frequencies, divided by the expected frequencies.
A critical chi-square value is used to determine if the calculated chi-square value is significant.
The degrees of freedom for the chi-square test are calculated by multiplying the number of rows minus one by the number of columns minus one.
Data Tab provides a table for critical chi-square values based on significance levels and degrees of freedom.
If the calculated chi-square value is less than the critical value, the null hypothesis of no relationship is not rejected.
Data Tab offers many tutorials for statistical analysis, including the chi-square test.
Transcripts


5.0 / 5 (0 votes)
Thanks for rating: