p-Value (Statistics made simple)
TLDRThis video script offers an insightful explanation of the P value, a crucial concept in statistical analysis. It uses the example of investigating salary differences between men and women to illustrate the concept of the null hypothesis, which assumes no difference in the population. The script explains how to calculate the P value using a sample to test the null hypothesis, and how a P value is interpreted in relation to the significance level or alpha level, which is set before an examination. The video also guides viewers on how to use Data Tab, an online tool, to perform statistical calculations and interpret results, encouraging viewers to subscribe for more informative content.
Takeaways
- 🔍 The P value is a statistical measure used to test the null hypothesis, which assumes no difference in a given parameter, such as salary, between groups.
- 👥 The example in the script investigates the salary difference between men and women, using the null hypothesis that there is no difference.
- 📊 A sample is taken from the population to represent and analyze because it's impractical to survey the entire population.
- 💡 The P value indicates the likelihood of observing a sample with a certain difference (or more extreme) if the null hypothesis is true.
- 🎯 A low P value (e.g., 0.03) suggests that it's unlikely to have drawn a sample with such a difference if the null hypothesis were true, hinting at a possible real difference.
- 📉 The significance level (alpha level) is set before conducting a test to determine when to reject the null hypothesis; common levels are 1% or 5%.
- 📍 A result is considered highly significant if the P value is below 1%, significant if below 5%, and not significant if above 5%.
- 🔢 The P value is calculated using statistical software or tools, such as Data Tab, which can perform t-tests for independent samples.
- 🛠️ Data Tab is an online tool that can be used to easily calculate P values and interpret statistical results with the help of descriptive statistics.
- 📚 The script encourages viewers to visit data.net for tutorials on how to use Data Tab for data analysis.
- 📢 The video is part of a series, and viewers are encouraged to subscribe to the channel for updates on new content.
Q & A
What is the primary focus of the video?
-The video focuses on explaining the concept of the P value in the context of investigating the difference in salary between men and women.
What is the null hypothesis in the context of the video?
-The null hypothesis is the assumption that there is no difference in the salary of men and women in the population.
Why is it not feasible to ask every individual in the population about their salary?
-It is not feasible due to the impracticality of surveying an entire country's population, which would include all women and men.
What is the role of a sample in this context?
-A sample is a subset of the population used to represent the whole. It includes a group of women and men whose salaries are asked to make inferences about the entire population.
What does the P value represent in the context of the video?
-The P value represents the probability of observing a sample where the salary of men and women differs by a certain amount (e.g., €250) or more, assuming the null hypothesis is true.
What does a P value of 0.03 imply in the video's example?
-A P value of 0.03 implies that there is only a 3% chance of drawing a sample with a salary difference of €250 or more if there is truly no salary difference in the population.
What is the significance of the alpha level in statistical testing?
-The alpha level, also known as the significance level, is a threshold that determines when the null hypothesis can be rejected. It is set before the examination and is not changed afterward.
What are the common alpha levels used in statistical testing?
-Common alpha levels used are 1% and 5%. An alpha level of 1% or below is considered highly significant, while 5% or below is considered significant.
What does it mean if the P value is less than the alpha level?
-If the P value is less than the alpha level, it suggests that the results are statistically significant, and the null hypothesis can be rejected.
How can one calculate the P value using an online tool as mentioned in the video?
-One can calculate the P value using an online tool like Data Tab by entering their data into the statistics calculator, selecting the appropriate variables, and letting the tool perform the t-test for independent samples.
What additional feature does Data Tab offer to help interpret the results?
-Data Tab offers a 'Summary in Words' feature that provides an interpretation of the results in a more understandable format.
What is the final advice given to viewers who want to learn more about Data Tab?
-The final advice is to visit data.net for helpful tutorials and to easily analyze data directly online.
Outlines
🔢 Understanding the P Value and Hypothesis Testing
This paragraph introduces the concept of the P value in the context of investigating salary differences between men and women. The speaker begins by explaining the null hypothesis, which assumes no salary difference in the population. They discuss the impracticality of surveying an entire population and the necessity of drawing a sample to make inferences. The P value is then described as a measure of the likelihood of observing a sample with a certain salary difference or more, assuming the null hypothesis is true. The speaker uses the example of a salary difference of €250 and a P value of 0.03 to illustrate that it's only 3% likely to observe such a difference if there is no actual difference in the population. The significance of the alpha level, set before an examination to determine when to reject the null hypothesis, is also explained, with common levels being 1% and 5%. The alpha level defines what is considered significant or highly significant in the results. The P value is further defined as the probability of observing the result or something more extreme if the null hypothesis is true.
📊 Calculating the P Value Using Data Tab
The second paragraph demonstrates how to calculate the P value using an online tool called Data Tab. The speaker guides the viewer to data.net and its statistics calculator to perform a t-test for independent samples, using gender and salary as variables. They explain that after inputting data and selecting the variables, Data Tab automatically calculates the t-test and provides descriptive statistics along with the resulting P value. The speaker also mentions the 'summary in words' feature of Data Tab, which offers an interpretation of the results. The paragraph concludes with an invitation for viewers to explore Data Tab for tutorials and online data analysis, and a prompt to subscribe to the channel for updates on new videos.
Mindmap
Keywords
💡P value
💡Null hypothesis
💡Sample
💡Population
💡Salary difference
💡Significance level (alpha level)
💡Statistical significance
💡Data tab
💡T-test
💡Descriptive statistics
Highlights
Introduction to explaining the P value with an example.
Investigation of salary differences between men and women.
Understanding the null hypothesis in statistical testing.
The impracticality of surveying an entire population.
Drawing a sample to represent the population.
The inevitability of sample differences despite the null hypothesis.
Explaining the P value in the context of sample salary differences.
Calculating the P value for different salary difference scenarios.
Interpreting a P value of 0.03 as a 3% likelihood.
Introduction to the alpha level and its significance in hypothesis testing.
Setting the alpha level before examination and its importance.
Definition of highly significant and significant results based on alpha levels.
The decision point for rejecting the null hypothesis.
General definition of the P value in statistical terms.
Demonstration of calculating P value using Data Tab.
Guidance on using Data Tab for statistical analysis.
Invitation to subscribe for more informative videos.
Transcripts
Browse More Related Video

p-value - easily explained with an example

What Is A P-Value? - Clearly Explained

Meaning of P-value and Alpha

P Value and Hypothesis Testing Simplified|P-value and Hypothesis testing concepts in Statistics
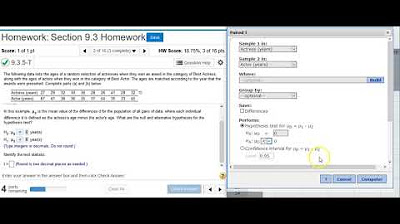
Using StatCrunch to perform hypothesis testing on two matched pair means of acting award ages
Hypothesis testing: step-by-step, p-value, t-test for difference of two means - Statistics Help
5.0 / 5 (0 votes)
Thanks for rating: