Finding P-Value for a Z-Test Using the TI-84
TLDRThis instructional video script guides viewers on how to determine the P-value for a given standardized test statistic and decide whether to reject or fail to reject the null hypothesis based on a specified level of significance. It demonstrates the process through examples, including negative and positive z-scores, left-tail, right-tail, and two-tailed tests. The script emphasizes the importance of setting the alpha level before conducting the test and illustrates how to use a TI-84 calculator to find P-values. It also highlights common mistakes to avoid, such as incorrectly multiplying P-values in two-tailed tests, and encourages viewers to practice and verify their understanding.
Takeaways
- 📚 The video aims to demonstrate how to calculate the P-value for a given standardized test statistic and tail of the test to make decisions on hypothesis testing.
- 📉 For a left-tailed test with a z-score of -2.05 and alpha level of 0.05, a picture is drawn to visualize the area corresponding to the z-score, and the P-value is found to be the area to the left of the tail.
- 🔢 The TI-84 calculator is used to find the P-value for the given z-score, using the normalcdf function with specific inputs to represent the tail.
- 🤔 The decision to reject or fail to reject the null hypothesis is based on comparing the calculated P-value to the predetermined alpha level.
- 📉 For a right-tailed test with a z-score of 1.87 and alpha level of 0.10, the process involves finding the area to the right of the z-score and using the normalcdf function with positive infinity as the upper limit.
- 🔑 The importance of setting the alpha level before starting the hypothesis test is emphasized, as it should not be altered based on the results obtained.
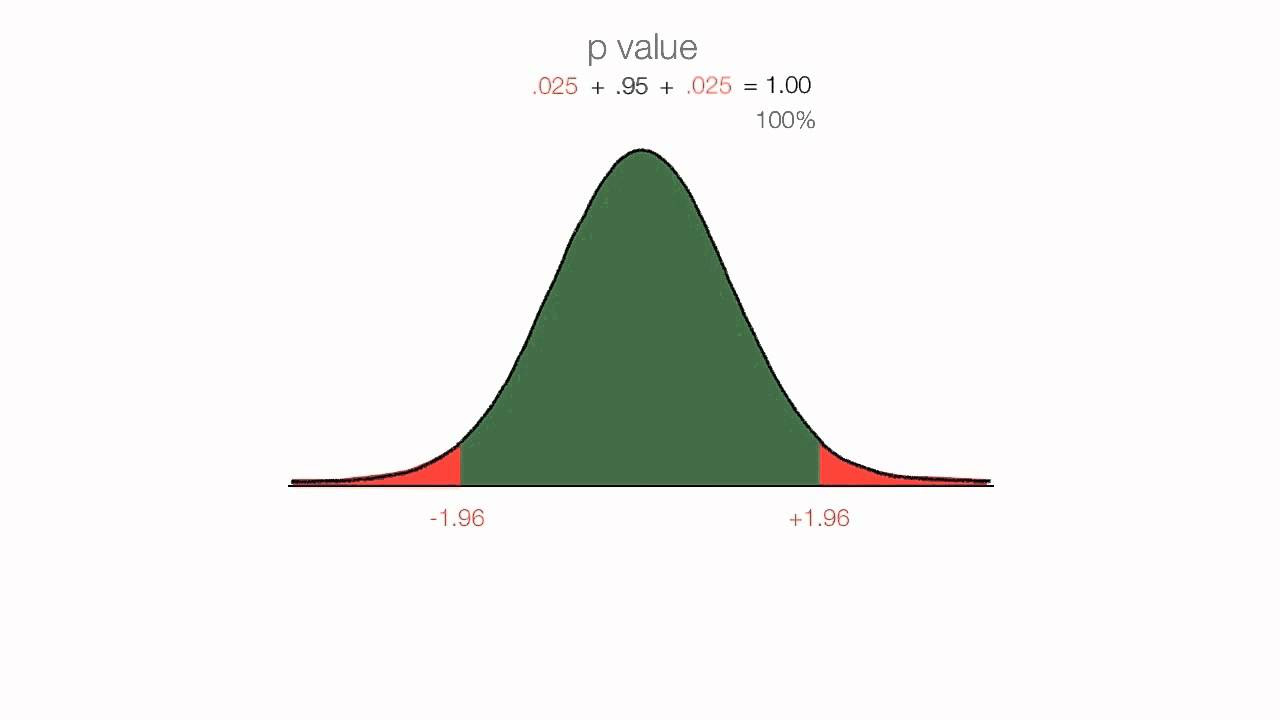
- 📊 In a two-tailed test, the P-value is split between the two tails, and the process involves finding the area in one tail and doubling it to get the total P-value.
- 📝 The video provides a step-by-step guide on using a graphing calculator to find P-values, including how to input values correctly to avoid errors.
- 📉 The video script includes a mistake demonstration to highlight common errors and the importance of learning from them in the hypothesis testing process.
- 📝 The video encourages viewers to practice by drawing their models and calculating P-values before watching the solution to ensure understanding.
- 🤓 The presenter invites questions and requests for additional topics, showing an openness to further educate and assist viewers.
Q & A
What is the purpose of the video?
-The purpose of the video is to demonstrate how to find a P-value for a given standardized test statistic and the tail of the test, and then make a decision on whether to reject or fail to reject the null hypothesis based on a given level of significance.
What is the first standardized test statistic given in the video?
-The first standardized test statistic given in the video is z = -2.05.
What type of tail test is associated with the first example in the video?
-The first example in the video is associated with a left-tail test.
What is the significance level (alpha) used in the first example of the video?
-The significance level (alpha) used in the first example of the video is 0.05.
How does one determine the P-value for a given z-score?
-The P-value for a given z-score can be determined using a z-table, a normal table, or technology such as a calculator to find the area corresponding to the z-score in the specified tail.
What tool does the video recommend for finding the P-value?
-The video recommends using a TI-84 calculator to find the P-value by utilizing the normalcdf function.
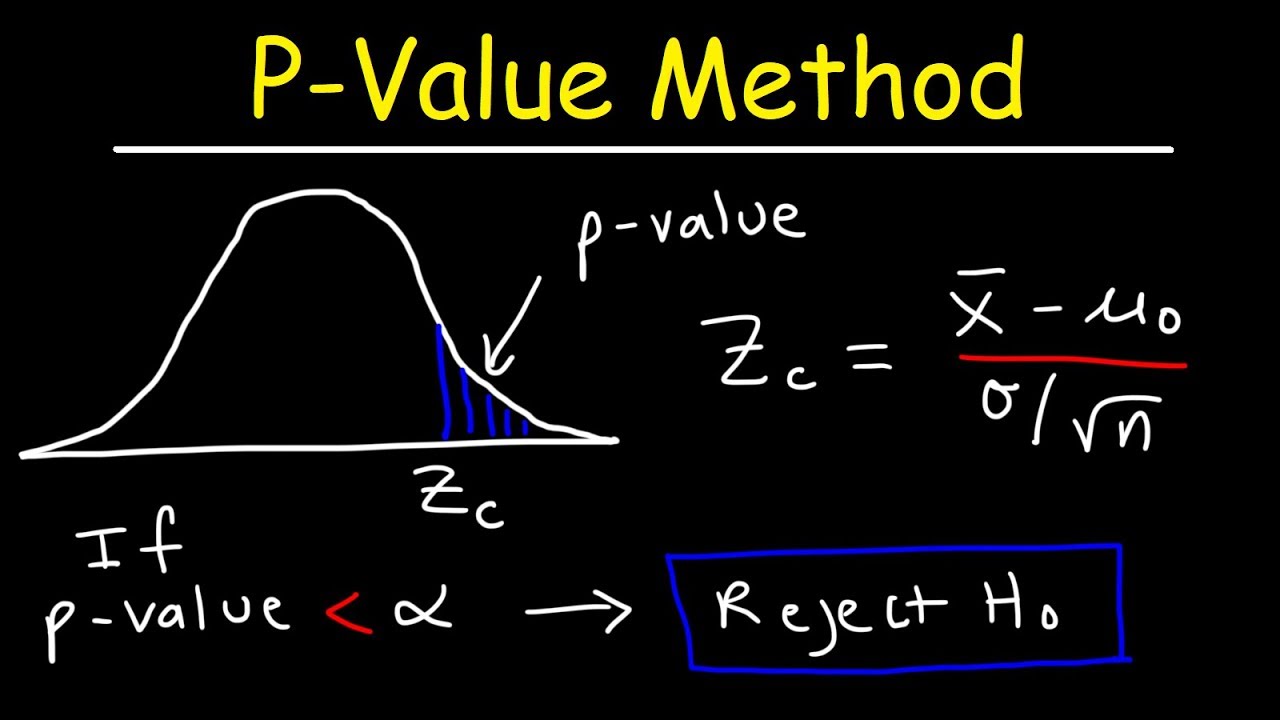
What is the decision rule for hypothesis testing based on the P-value and alpha level?
-The decision rule for hypothesis testing is to reject the null hypothesis if the P-value is less than or equal to the alpha level, and fail to reject the null hypothesis if the P-value is greater than the alpha level.
What is the second standardized test statistic and tail type mentioned in the video?
-The second standardized test statistic mentioned in the video is z = 1.87, and it is a right-tailed test.
What is the alpha level for the second example in the video?
-The alpha level for the second example in the video is 0.10.
How does the video explain the process for a two-tailed test?
-For a two-tailed test, the video explains that the P-value is split between the two tails, and the area that is more extreme than the given z-score is found and then multiplied by 2 to get the total P-value.
Why is it important to set the alpha level before starting the hypothesis test?
-It is important to set the alpha level before starting the hypothesis test to ensure the integrity of the test and to prevent manipulation of the results based on the observed data.
What is the process for finding the P-value using a calculator as shown in the video?
-The process involves using the normalcdf function on a calculator, setting the lower limit to the z-score or negative 1E99 for left-tailed tests, and the upper limit to positive infinity represented by 1E99 for right-tailed tests. Then, the calculator provides the area corresponding to the specified tail.
What mistake does the video demonstrate and why is it important to learn from it?
-The video demonstrates the mistake of forgetting whether to multiply the P-value by 2 for a two-tailed test. It is important to learn from this mistake to understand the correct process and avoid similar errors in hypothesis testing.
How does the video conclude?
-The video concludes by encouraging viewers to pause and try the examples themselves, and then resume watching to check their answers. It also invites viewers to ask questions or request additional topics for future videos.
Outlines
📊 Hypothesis Testing with Z-Score and P-Value
This paragraph introduces the process of hypothesis testing using a standardized test statistic, specifically a z-score of -2.05 for a left-tailed test with an alpha level of 0.05. The speaker emphasizes the importance of visualizing the problem by drawing a picture and identifying the area corresponding to the z-score. The P-value, which is the area to the left of the tail, is calculated using a TI-84 calculator with the 'normalcdf' function, setting the lower limit to -1E99 and the upper limit to the z-score. The result, 0.0202, is compared to the alpha level, leading to the rejection of the null hypothesis due to the P-value being less than alpha.
📈 Right-Tailed Test and Two-Tailed Test Calculations
The second paragraph continues the discussion on hypothesis testing, now covering a right-tailed test with a z-score of 1.87 and an alpha level of 0.10. The process involves using the 'normalcdf' function on a calculator, setting the lower limit to the z-score and the upper limit to positive infinity. The resulting P-value of 0.0307 leads to the rejection of the null hypothesis as it is less than alpha. Subsequently, a two-tailed test is introduced with a z-score of 1.92 and an alpha level of 0.05. The P-value is calculated by finding the area to the right of the z-score and doubling it, resulting in 0.0548. This P-value is compared to alpha, leading to a failure to reject the null hypothesis as it is greater than alpha.
📉 Correct Approach to Hypothesis Testing and Avoiding Errors
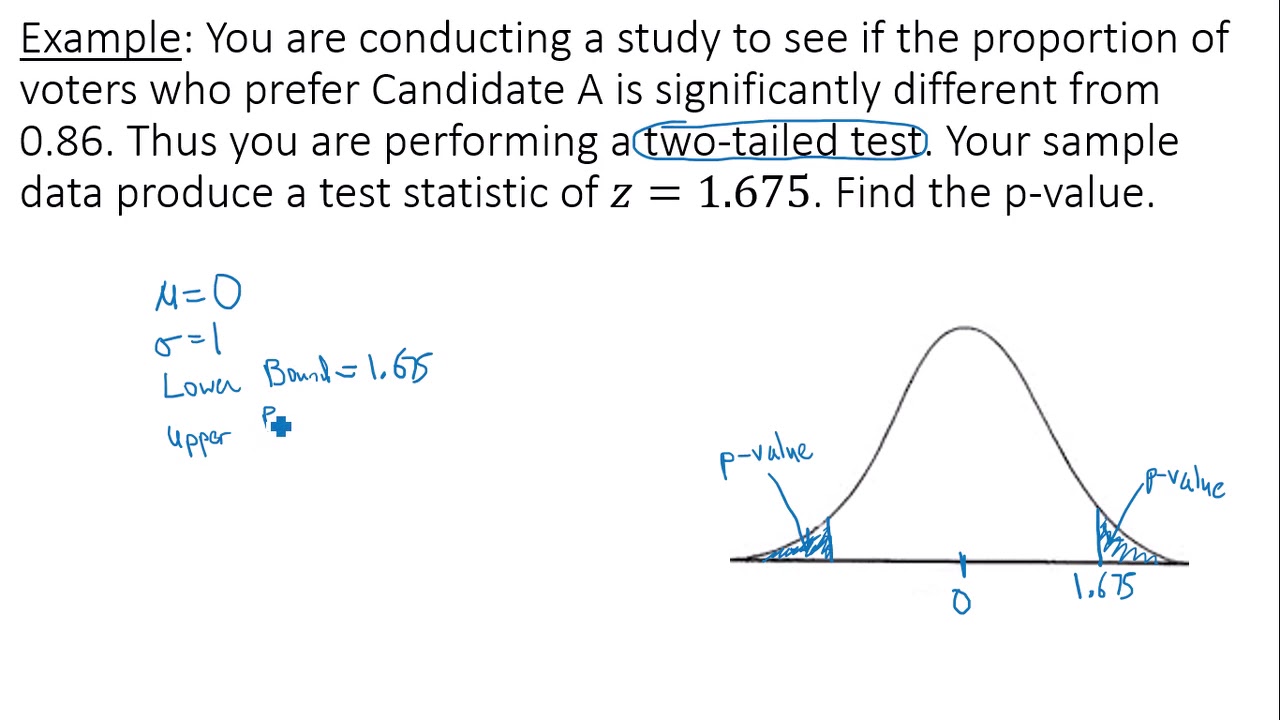
The final paragraph focuses on the correct approach to hypothesis testing, highlighting the importance of setting the alpha level before starting the test and not altering it based on the results. It provides an example of a two-tailed test with a z-score of 1.75 and an alpha level that is not specified, but the P-value calculation is demonstrated. The speaker also discusses a right-tailed test with a z-score of 1.99 and an alpha level of 0.10, resulting in a P-value of approximately 0.0233, which leads to the rejection of the null hypothesis. The paragraph concludes with a reminder to avoid common mistakes, such as forgetting to multiply the P-value by 2 in two-tailed tests, and encourages viewers to practice the concepts covered in the video.
Mindmap
Keywords
💡P-value
💡Standardized test statistic
💡Null hypothesis
💡Level of significance (alpha)
💡Left-tailed test
💡Right-tailed test
💡Two-tailed test
💡Normalcdf
💡Graphing calculator
💡Reject/Fail to reject the null hypothesis
Highlights
Introduction to finding P-value for a given standardized test statistic and tail of the test.
Explanation of hypothesis testing decision-making process based on the level of significance.
Demonstration of drawing a picture for hypothesis tests, emphasizing its importance.
Procedure to find the P-value for a left-tailed test with z = -2.05 and alpha = 0.05.
Use of the TI-84 calculator to find the P-value for the given z-score.
Step-by-step guide on using normalcdf function on a calculator for hypothesis testing.
Comparison of P-value to alpha level to decide whether to reject or fail to reject the null hypothesis.
Example of rejecting the null hypothesis when P-value (0.0202) is less than alpha (0.05).
Introduction to a right-tailed test with z = 1.87 and alpha = 0.10.
Emphasis on setting alpha levels before starting the hypothesis test to avoid bias.
Process of finding the P-value for a right-tailed test and comparing it to alpha.
Rejection of the null hypothesis when P-value (0.0307) is less than alpha (0.10).
Introduction to a two-tailed test and the method to find the P-value.
Explanation of how to calculate P-value for a two-tailed test by doubling the extreme area.
Example of failing to reject the null hypothesis when P-value (0.0549) is greater than alpha (0.05).
Importance of setting alpha levels before starting the test to maintain the integrity of the results.
Instructions for the audience to pause the video and practice finding P-values for two additional examples.
Review of the process for a two-tailed test with z = 1.75 and alpha comparison.
Review of a right-tailed test with z = 1.99, finding the P-value, and comparing it to alpha.
Rejection of the null hypothesis when P-value (0.0233) is less than alpha (0.10).
Final reminder of the importance of not manipulating alpha levels after seeing test results.
Invitation for viewers to ask questions or suggest additional topics for future videos.
Transcripts
Browse More Related Video


5.0 / 5 (0 votes)
Thanks for rating: