[3.1.17] Finding the mean, median, mode, midrange, and outliers of a data set
TLDRIn this video, Professor Curtis from Aspire Mountain Academy demonstrates how to find the mean, median, mode, mid-range, and outliers of a dataset using StatCrunch. The example used involves the costs of marriage proposal packages at various sports venues. Curtis walks through the process step-by-step, showing how to input data, calculate necessary statistics, and identify outliers using a box plot. This educational video aims to assist students in mastering these statistical concepts efficiently.
Takeaways
- 📚 The video is a statistics homework help tutorial by Professor Curtis from Aspire Mountain Academy.
- 📈 The objective is to teach how to find the mean, median, mode, mid-range, and identify outliers in a dataset.
- 💰 The dataset provided relates to the costs of marriage proposal packages at different sports venues.
- 🔍 The mean is calculated using a software called StatCrunch, which simplifies the process.
- 📊 To find the median, the video suggests using the same software and switching from mean to median in the options.
- 🔢 The mode is also calculated through StatCrunch, and the video mentions that it has been pre-calculated with the median.
- 📉 The mid-range is not directly available in StatCrunch, so the video demonstrates alternative methods to calculate it manually.
- 📝 The video explains three ways to calculate the mid-range: by averaging the minimum and maximum values, or by adding half the range to the minimum or subtracting it from the maximum.
- 📊 For identifying outliers, the video suggests using a box plot, a graphical representation that helps visualize data distribution.
- 🚫 The video identifies two outliers in the dataset: values of 1500 and 2500, which are significantly higher than the rest.
- 💡 The video encourages viewers to provide feedback and suggests visiting aspiremountecon.com for more learning resources.
Q & A
What is the first step to find the mean of the data set in StatCrunch?
-The first step is to input the data into StatCrunch and then use the 'Summary Stats' function to calculate the mean.
How do you find the median using StatCrunch?
-To find the median, go to 'Options', then 'Edit', and select 'Median' in the summary statistics options.
How can you calculate the mode in StatCrunch?
-In the 'Edit' options for summary statistics, select 'Mode' along with any other statistics you need.
What does the mid-range represent and how can it be calculated?
-The mid-range is the value in the middle of the range between the minimum and maximum values. It can be calculated by averaging the minimum and maximum values or by adding half the range to the minimum value or subtracting half the range from the maximum value.
Why does StatCrunch not directly calculate the mid-range?
-StatCrunch does not have a direct function for the mid-range, so it must be calculated manually using the range, minimum, and maximum values.
What is the formula to calculate the mid-range using the range and minimum value?
-The formula is: (Range / 2) + Minimum value.
How can you determine outliers in the data set using StatCrunch?
-Outliers can be determined by creating a box plot in StatCrunch, which graphically represents outliers as dots outside the whiskers of the plot.
Which values in the data set are identified as outliers in the box plot?
-The values 1500 and 2500 are identified as outliers.
What is the benefit of drawing the box plot horizontally?
-Drawing the box plot horizontally makes it easier to interpret as it aligns with the number line and simplifies identifying outliers.
What should you do if you think your statistics teacher is boring or unhelpful according to the video?
-You should visit Aspire Mountain Academy’s website to access more lecture videos and learn statistics.
Outlines
📊 Statistical Analysis: Mean, Median, Mode, and Mid-range
Professor Curtis from Aspire Mountain Academy introduces a video tutorial on statistical analysis. The focus is on calculating the mean, median, mode, and mid-range of a given dataset, specifically the costs of marriage proposal packages at various sports venues. The professor demonstrates the use of StatCrunch software to find the mean and median, and then explains the process of identifying the mode and mid-range. The video also addresses the question of outliers within the dataset.
📈 Identifying Outliers with Box Plots
In the second part of the video, the professor discusses how to identify outliers in a dataset. Initially, the professor suggests a visual inspection of the data, pointing out that certain values seem to be significantly different from the rest. To confirm the presence of outliers, the professor recommends creating a box plot using StatCrunch. The box plot graphically represents the dataset and clearly marks any outliers. In the given dataset, the values 1500 and 2500 are identified as outliers. The video concludes with an invitation for viewers to provide feedback and visit Aspire Mountain Academy's website for more educational resources.
Mindmap
Keywords
💡Mean
💡Median
💡Mode
💡Mid-range
💡Outliers
💡Data Set
💡Statistical Analysis
💡StatCrunch
💡Box Plot
💡Summary Statistics
💡Range
Highlights
Introduction to finding the mean, median, mode, mid-range, and outliers of a dataset.
Using StatCrunch to calculate the mean of a dataset.
Explanation of how to input data into StatCrunch for analysis.
Demonstration of selecting summary statistics in StatCrunch.
Calculating the median through StatCrunch's options.
Inclusion of mode and mid-range in the calculation process.
Explanation of the order of statistics in the results window.
Guide on finding the mode without recalculating.
Lack of a direct mid-range function in StatCrunch and the workaround.
Calculating the mid-range using the range, min, and max values.
Different methods to calculate the mid-range explained.
Identifying outliers in a dataset through graphical representation.
Using a box plot in StatCrunch to visualize outliers.
Explanation of how to interpret a box plot for outliers.
Identification of specific outliers in the provided dataset.
Encouragement for feedback and comments on the video.
Promotion of Aspire Mountain Academy's resources for learning statistics.
Transcripts
Browse More Related Video
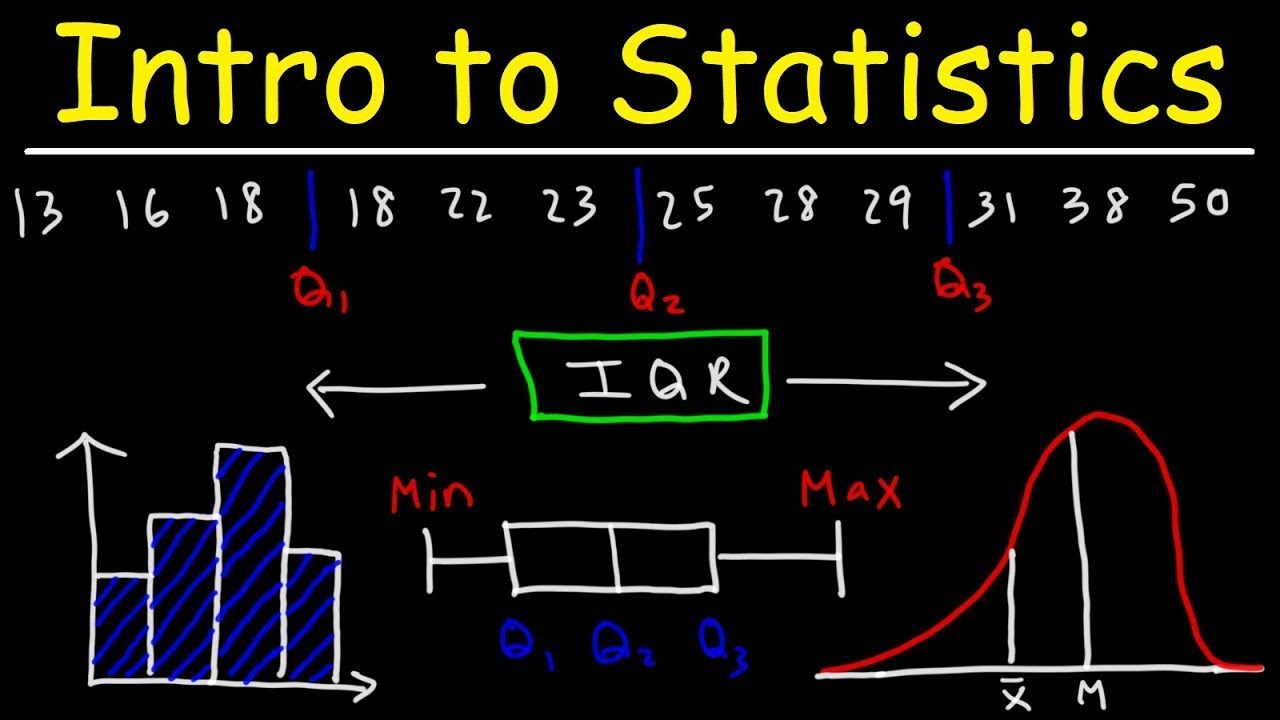
Introduction to Statistics

Math 119 Chapter 3 part 2
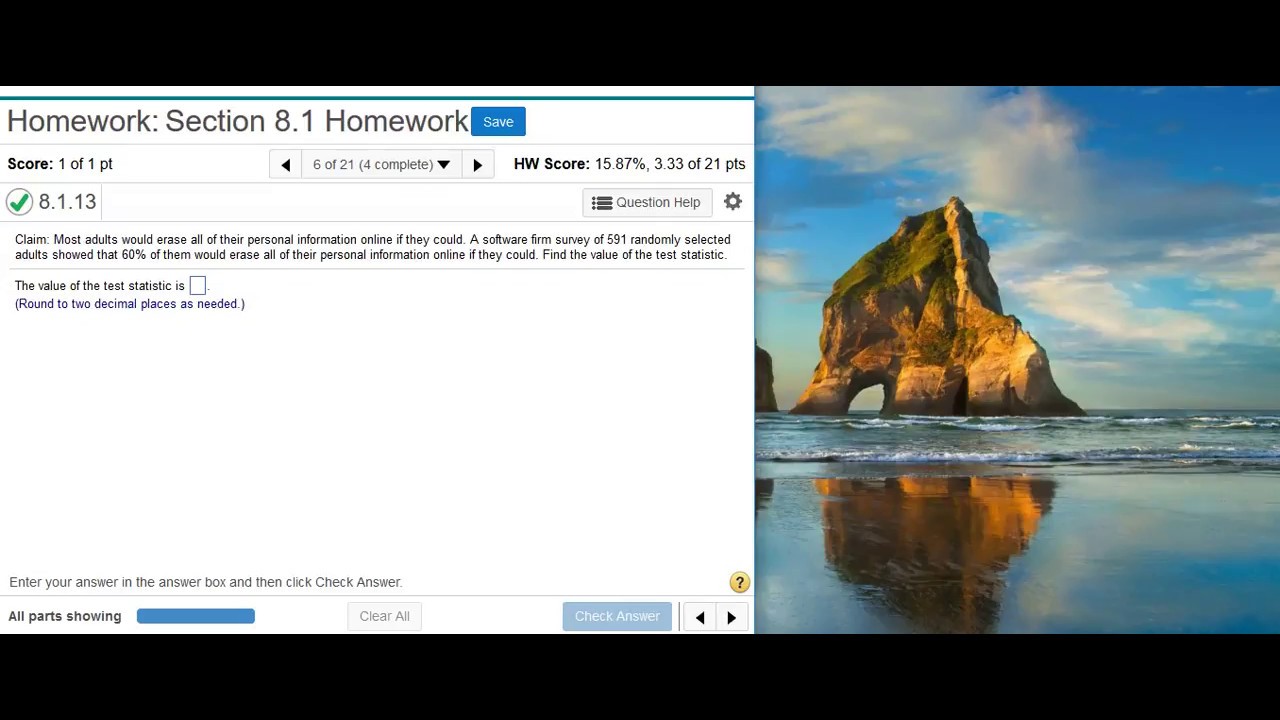
Finding the value of the test statistic for hypothesis testing on proportions
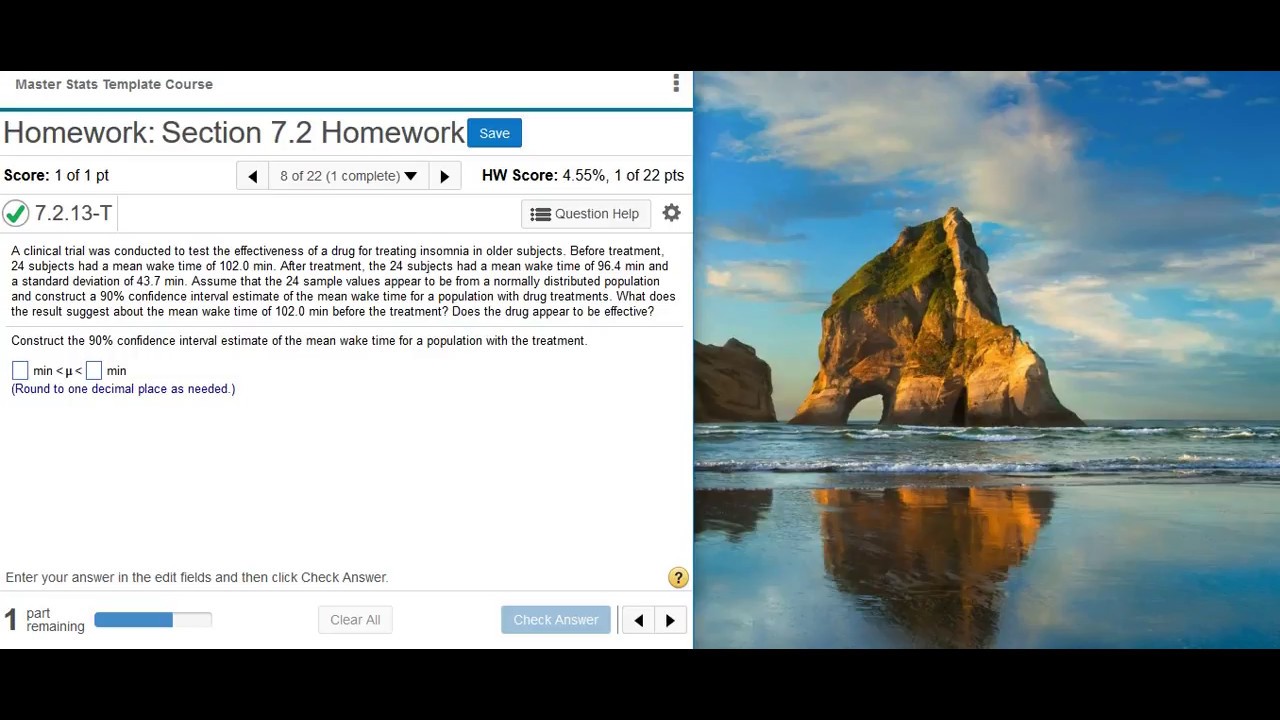
Finding and interpreting a confidence interval for a population mean (σ unknown)
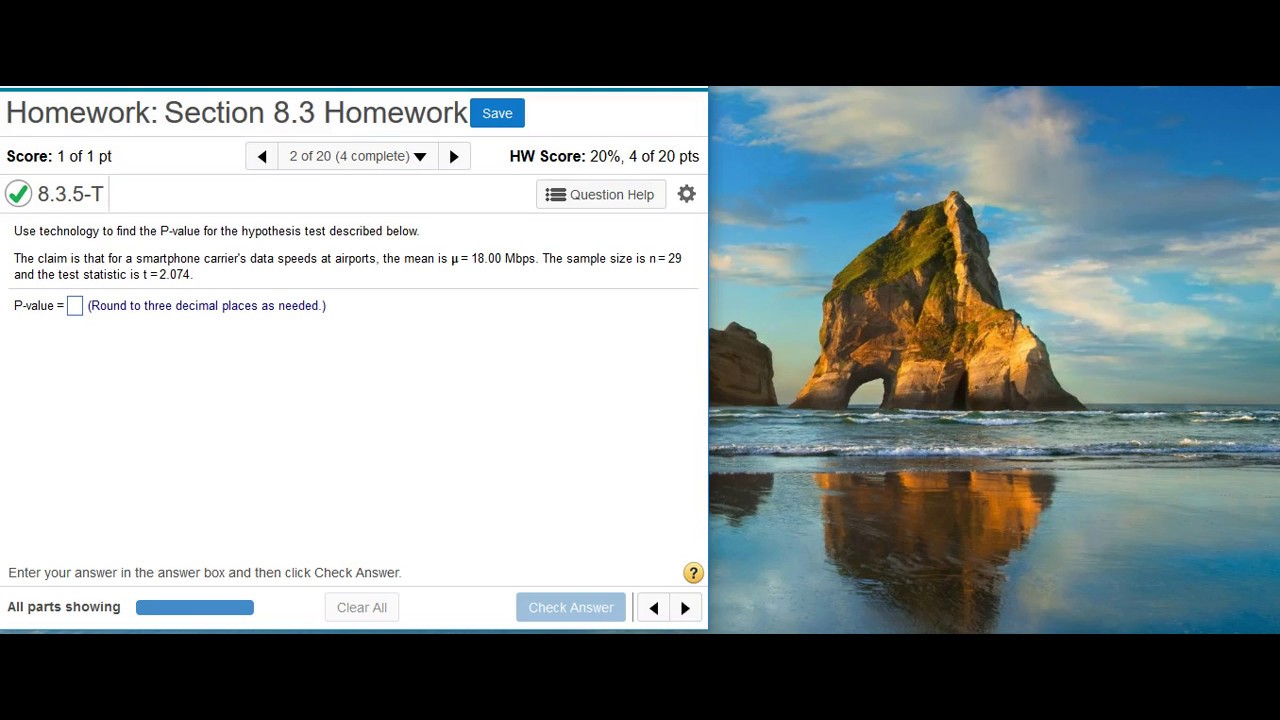
Finding a P-value given the test statistic

[6.4.6-T] Finding probabilities for different sample sizes using a nonstandard normal distribution
5.0 / 5 (0 votes)
Thanks for rating: