Finding a P-value given the test statistic
TLDRIn this informative video, Professor Curtis from Aspire Mountain Academy guides viewers through the process of finding a p-value for a hypothesis test. The scenario involves a claim about the mean data speed of smartphone carriers at airports, with a given sample size and test statistic. Curtis explains that the p-value represents the area in the tail of the distribution, which is bounded by the test statistic. He demonstrates the use of the Student T-distribution, given the T-score nature of the test statistic, and calculates the degrees of freedom. The video then explores setting up the correct inequality for the alternative hypothesis, accounting for a two-tailed test. Using StatCrunch, Curtis shows how to input the positive and negative T-statistics and compute the p-value by taking the complement of the area between the tails. The video concludes with an invitation for viewers to engage with the academy for more statistics help and feedback.
Takeaways
- 📚 The p-value is the area in the tail of the distribution bounded by the test statistic, which provides the boundary for that area.
- 📊 The test statistic given in the problem is a t-score, indicating that the Student's t-distribution should be used for the hypothesis test.
- 🔢 Degrees of freedom for the t-distribution are calculated as one less than the sample size, which in this case is 28 (n=29).
- ⚖️ The null hypothesis claims that the mean data speed is 18.00 megabytes per second, with equality belonging to the null hypothesis.
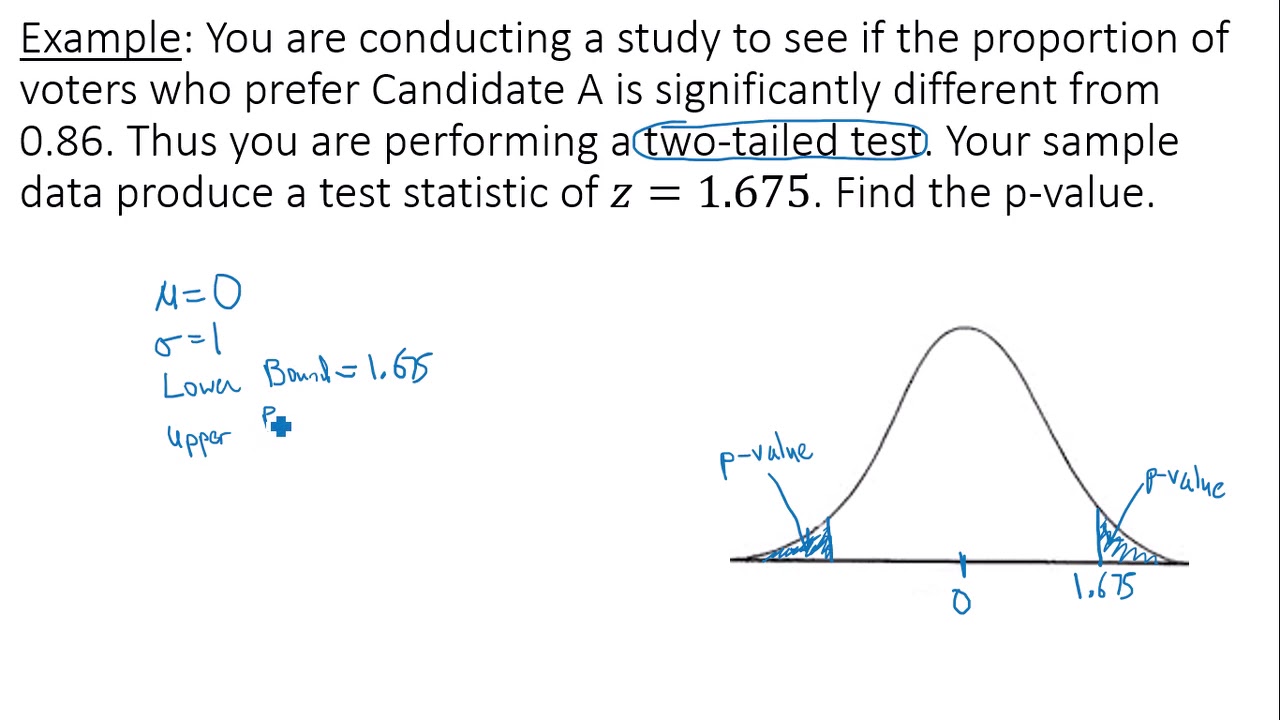
- 🔁 The alternative hypothesis is the complement of the null hypothesis, resulting in a two-tailed test since the claim is about not being equal to 18.00.
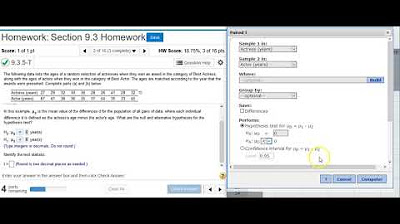
- 💡 In StatCrunch, the 'between' option is used for a two-tailed test, as it splits the p-value between the left and right tail of the distribution.
- 📐 The test statistic values (positive and negative) are input into the Student t-calculator in StatCrunch to find the p-value.
- 🧮 The p-value is found by taking the complement of the area between the tails calculated by StatCrunch, as the p-value represents the area of the tails.
- 📈 The final p-value is rounded to three decimal places for accuracy.
- 📝 It's important to understand the concept of p-value and how it is derived from the test statistic and the chosen distribution.
- 🌟 Aspire Mountain Academy offers more statistics help and lecture videos for those needing additional assistance in learning statistics.
- ✅ Engage with the community by leaving comments and providing feedback on the content for continuous improvement.
Q & A
What is the main topic of the video?
-The main topic of the video is how to find a p-value given a test statistic within the context of a hypothesis test related to data speeds of smartphone carriers at airports.
What is the claim being tested in the hypothesis?
-The claim being tested is that the mean data speed for smartphone carriers at airports is 18.00 megabytes per second.
What is the sample size used in the hypothesis test?
-The sample size used in the hypothesis test is 29.
What is the test statistic value given in the problem statement?
-The test statistic value given is T equals 2.074.
Why is the test statistic important in finding the p-value?
-The test statistic is important because it provides the boundary for the area in the distribution that the p-value represents.
Which distribution is being used for the hypothesis test?
-The Student T-distribution is being used for the hypothesis test because the test statistic is a T-score.
How is the degrees of freedom calculated for the Student T-distribution?
-The degrees of freedom is calculated as one less than the sample size, which in this case is 28 (29 - 1).
What does the alternative hypothesis represent in this context?
-The alternative hypothesis represents the complement of the null hypothesis, indicating that the mean is not equal to 18.00 megabytes per second, which leads to a two-tailed test.
How does one determine the p-value using StatCrunch?
-One determines the p-value by using the Student T-distribution calculator in StatCrunch, inputting the test statistic and degrees of freedom, and then taking the complement of the area between the tails.
What is the significance of a two-tailed test in this scenario?
-A two-tailed test is significant because it considers both directions from the mean (both higher and lower values), which is appropriate when the alternative hypothesis is that the mean is not equal to a certain value.
What is the final step to find the p-value using the calculator?
-The final step is to compute the area between the tails using the calculator, and then take the complement of this area to find the p-value in the tails.
How does the video conclude?
-The video concludes by encouraging viewers to leave comments, visit Aspire Mountain Academy for more statistics help, and offering to provide additional lecture videos or feedback.
Outlines
📚 Understanding P-Values in Hypothesis Testing
Professor Curtis introduces the concept of p-values in the context of hypothesis testing. He explains that a p-value is the area in the tail of a distribution that is bounded by the test statistic. The problem statement involves determining the p-value for a claim about the mean data speed of smartphone carriers at airports, with a given sample size and test statistic. The test statistic is a t-score, indicating the use of the Student's t-distribution. The professor uses StatCrunch to calculate the p-value, considering the degrees of freedom and the alternative hypothesis, which is a two-tailed test due to the complement of the equality in the claim. The final step involves computing the p-value as the complement of the area between the tails of the distribution.
Mindmap
Keywords
💡p-value
💡test statistic
💡Student T distribution
💡degrees of freedom
💡null hypothesis
💡alternative hypothesis
💡two-tailed test
💡sample size
💡statistical significance
💡complement
💡StatCrunch
Highlights
Professor Curtis from Aspire Mountain Academy is providing statistics homework help.
The focus is on learning how to find a p-value given a test statistic.
The problem statement involves a hypothesis test about smartphone carriers' data speeds at airports.
The claim is that the mean data speed is 18.00 megabytes per second.
The sample size for the test is 29.
The test statistic (T-score) given is 2.074.
The p-value is the area in the tail of the distribution bounded by the test statistic.
The test statistic is a T-score, indicating the use of the Student T-distribution.
StatCrunch is used to calculate the p-value using the Student T-distribution.
Degrees of freedom are calculated as one less than the sample size, resulting in 28.
The alternative hypothesis is determined by the complement of the null hypothesis, leading to a two-tailed test.
The p-value is split between the left and right tail of the distribution.
Positive and negative T-statistics are entered into the calculator for the two-tailed test.
The final p-value is obtained by taking the complement of the area between the tails.
The p-value is rounded to three decimal places.
Aspire Mountain Academy encourages feedback and comments to improve their statistics help.
Students can access more lecture videos or provide feedback on what they'd like to see next.
The video concludes with an invitation to see the next video in the series.
Transcripts
Browse More Related Video

Performing hypothesis testing on two proportions in StatCrunch

Finding the value of the test statistic for hypothesis testing on proportions
Using StatCrunch to perform hypothesis testing on two matched pair means of acting award ages

Using a z-score to complete hypothesis testing for a claim of equality

Using StatCrunch to perform hypothesis testing on two proportions of referee calls
Calculating a p-value for a Two-tailed Test
5.0 / 5 (0 votes)
Thanks for rating: