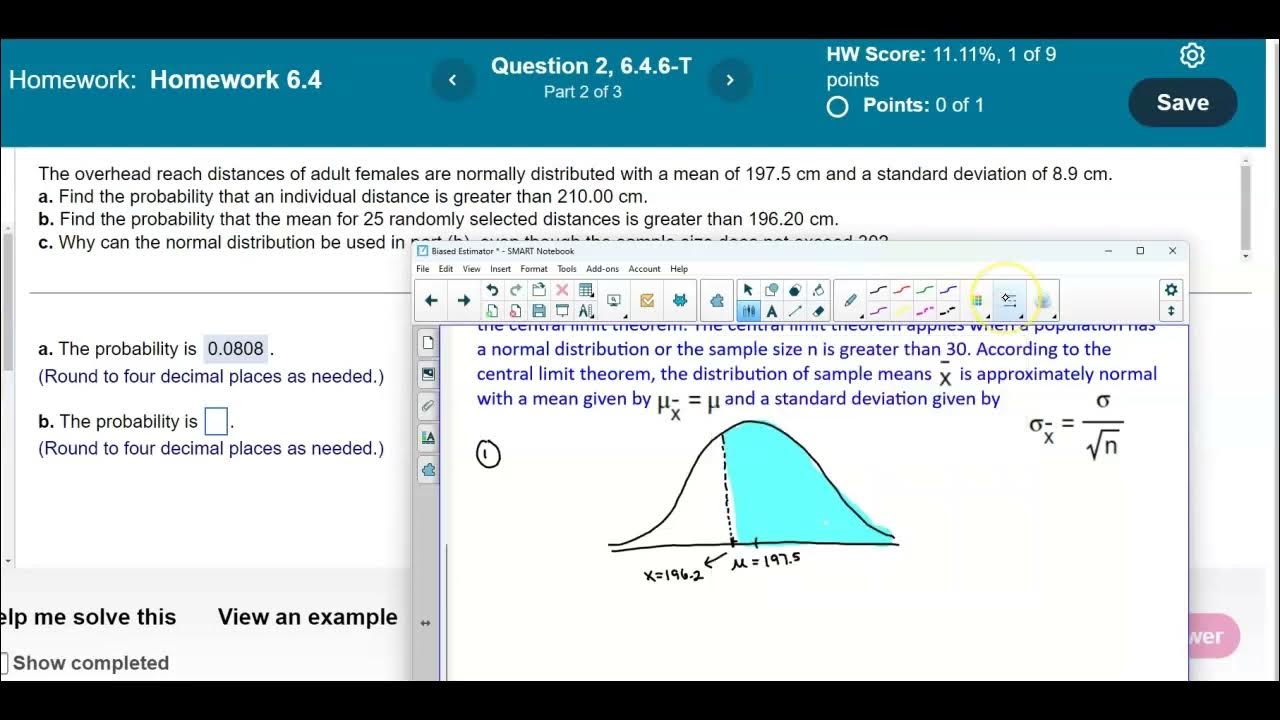
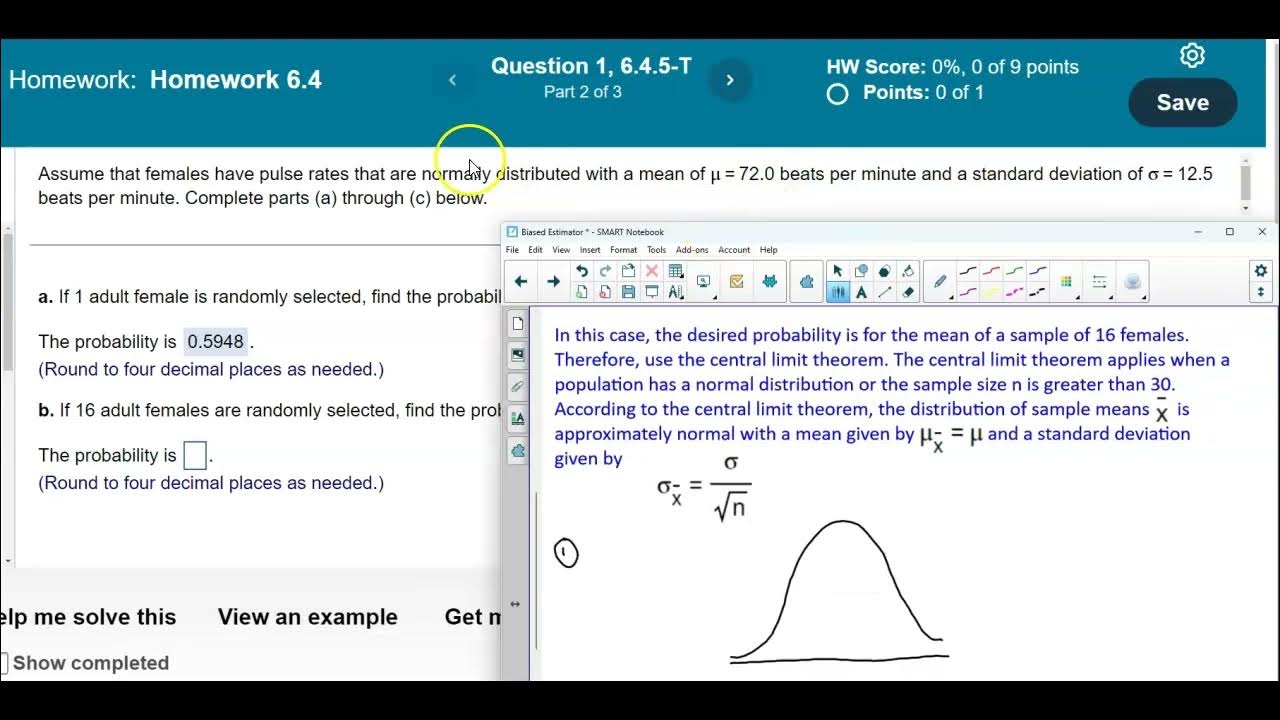
[6.4.6-T] Finding probabilities for different sample sizes using a nonstandard normal distribution
TLDRIn this Aspire Mountain Academy video, Professor Curtis offers a step-by-step guide on calculating probabilities for nonstandard normal distributions. He demonstrates using StatCrunch to find the probability of an individual's overhead reach exceeding 212.5 cm and adjusts the standard deviation for a sample mean exceeding 198.2 cm with a sample size of 20. Curtis emphasizes the Central Limit Theorem's flexibility in applying to normally distributed data regardless of sample size, providing clarity on its use in the context of the problem.
Takeaways
- 📚 Professor Curtis from Aspire Mountain Academy is providing statistics homework help on finding probabilities with a nonstandard normal distribution.
- 📊 The problem involves the overhead reach distances of adult females, which are normally distributed with a mean of 200 cm and a standard deviation of 8 cm.
- 🔍 Part A of the problem asks to find the probability of an individual distance being greater than 212.5 cm, which can be calculated using the Normal calculator in StatCrunch.
- 📝 Adjusting the mean and standard deviation in the Normal calculator is necessary to reflect the nonstandard normal distribution given in the problem statement.
- 👉 In the Normal calculator, selecting 'greater than' and entering 212.5 cm will compute the desired probability, which should be rounded to four decimal places.
- 🔄 Part B requires finding the probability that the mean of 20 randomly selected distances is greater than 198.2 cm, which involves an adjustment to the standard deviation.
- 📐 The adjustment for Part B is calculated by dividing the population standard deviation by the square root of the sample size (20 in this case), resulting in a new standard deviation for the sample mean.
- 💻 To avoid rounding errors, it's recommended to calculate the adjusted standard deviation using a computer calculator and then input it into StatCrunch.
- 🔢 After adjusting the standard deviation and entering the new random variable value of 198.2 cm, the Normal calculator will compute the probability for the sample mean.
- 📚 Part C discusses the use of the normal distribution in Part B, even with a sample size less than 30, referencing the Central Limit Theorem and the fact that the data is already normally distributed.
- 🎯 The Central Limit Theorem allows for the assumption of normality for the sample mean if the sample size is large enough, but it's not a requirement if the data is already normally distributed.
- 📝 Answer Option B is selected as the correct answer for Part C, emphasizing that the data's normal distribution is the reason for using the normal distribution in the problem.
Q & A
What is the topic of the video by Professor Curtis?
-The video is about finding probabilities for different sample sizes using a nonstandard normal distribution in the context of statistics homework help.
What is the mean and standard deviation of the adult females' overhead reach distances mentioned in the video?
-The mean of the overhead reach distances is 200 centimeters, and the standard deviation is 8 centimeters.
What is the probability calculation for Part A of the problem statement?
-Part A asks for the probability that an individual distance is greater than 212.5 cm, which is calculated using the normal distribution with the given mean and standard deviation.
Why does Professor Curtis use the Normal calculator in StatCrunch for the problem?
-The Normal calculator is used because the data are normally distributed, and it allows for the adjustment of mean and standard deviation to fit the nonstandard normal distribution given in the problem statement.
How does StatCrunch calculate the probability for an individual distance greater than a certain value?
-StatCrunch calculates the probability by setting the 'greater than' condition in the calculator and inputting the specific value, which in this case is 212.5 cm.
What adjustment is needed for the standard deviation when calculating the probability in Part B of the problem?
-For Part B, the standard deviation needs to be divided by the square root of the sample size to adjust for the sample mean of a larger sample.
Why is the sample size adjustment necessary when calculating the mean of 20 randomly selected distances?
-The adjustment is necessary because when dealing with a sample size greater than 1, the variability of the sample mean is reduced, which is accounted for by dividing the population standard deviation by the square root of the sample size.
What is the Central Limit Theorem and how does it relate to Part B of the problem?
-The Central Limit Theorem states that if the sample size is greater than 30, the sampling distribution of the sample mean will be approximately normally distributed. However, in this case, the data are already normally distributed, so there is no need for this assumption.
Why can the normal distribution be used in Part B even though the sample size is 20, which does not exceed 30?
-The normal distribution can be used because the data are already normally distributed, as stated in the problem. The Central Limit Theorem's sample size condition is not a requirement when the original distribution is already normal.
What is the significance of rounding the standard deviation to four decimal places before inputting it into StatCrunch?
-Rounding to four decimal places ensures precision in the calculation, avoiding potential discrepancies that could occur from rounding within the calculator itself, which might lead to incorrect results.
What is the final step in solving Part B of the problem after adjusting the standard deviation?
-The final step is to input the adjusted standard deviation into StatCrunch, set the condition for the mean of 20 randomly selected distances to be greater than 198.2 cm, and compute the probability.
What is the purpose of the Aspire Mountain Academy mentioned in the video?
-Aspire Mountain Academy provides additional resources such as lecture videos and homework help for students, especially in statistics, to enhance their learning experience and understanding.
Outlines
📚 Calculating Individual Probabilities with Nonstandard Normal Distribution
Professor Curtis introduces a statistics homework help video focused on finding probabilities for different sample sizes using a nonstandard normal distribution. He presents a problem involving the overhead reach distances of adult females, which are normally distributed with a mean of 200 cm and a standard deviation of 8 cm. The task is to find the probability that an individual distance exceeds 212.5 cm. The solution involves using StatCrunch's Normal calculator, adjusting the mean and standard deviation from the standard normal distribution to match the problem's nonstandard distribution, and computing the probability for the specified value. The result should be rounded to four decimal places.
🔍 Adjusting Standard Deviation for Sample Mean Probabilities
In the second part of the video, Professor Curtis addresses how to find the probability that the mean of 20 randomly selected distances is greater than 198.2 cm. He explains the need to adjust the standard deviation for a sample size greater than one, by dividing the population standard deviation by the square root of the sample size. Curtis demonstrates the calculation, ensuring precision by copying the exact value from a computer calculator into StatCrunch. He then inputs this adjusted standard deviation into the Normal calculator, sets the random variable value, and computes the probability, rounding it to four decimal places.
📘 Understanding the Central Limit Theorem in Nonstandard Normal Distributions
The final part of the script discusses why the normal distribution can be used in the previous calculation even though the sample size does not exceed 30, referencing the Central Limit Theorem. Curtis clarifies that while the theorem suggests a sample size greater than 30 for assuming normal distribution, it is not necessary when the data is already normally distributed. He concludes by selecting the correct answer option based on this understanding and encourages viewers to provide feedback or access more resources at Aspire Mountain Academy's website.
Mindmap
Keywords
💡Normal Distribution
💡Sample Size
💡Standard Deviation
💡Mean
💡Probability
💡StatCrunch
💡Central Limit Theorem
💡Random Variable
💡Confidence Interval
💡Calculation Adjustment
💡Rounding
Highlights
Introduction to finding probabilities for different sample sizes using a nonstandard normal distribution.
Problem statement: Adult females' overhead reach distances are normally distributed with a mean of 200 cm and a standard deviation of 8 cm.
Part A of the problem asks for the probability of an individual distance being greater than 212.5 cm.
Using StatCrunch to tackle the problem with a nonstandard normal distribution.
Adjusting the mean and standard deviation in the Normal calculator to match the problem statement.
Understanding the probability calculation as an area under the curve in the Normal calculator.
Computing the probability for an individual distance greater than 212.5 cm in StatCrunch.
Part B of the problem involves finding the probability that the mean of 20 randomly selected distances is greater than 198.2 cm.
Adjusting the standard deviation for a sample size greater than 1 using the population standard deviation and the square root of the sample size.
Avoiding rounding errors by using a computer calculator for the standard deviation adjustment.
Copying the precise standard deviation value into StatCrunch to avoid rounding errors.
Calculating the probability for the mean of 20 distances being greater than 198.2 cm in StatCrunch.
Rounding the probability to four decimal places for accuracy.
Part C discusses the use of the normal distribution in Part B despite the sample size not exceeding 30.
Explanation of the Central Limit Theorem and its relation to sample size and normal distribution.
Clarification that the normal distribution can be used because the data is already normally distributed, not due to the sample size.
Selecting the correct answer option for Part C based on the normal distribution being stated in the problem.
Encouragement for feedback and further learning at Aspire Mountain Academy.
Invitation to access lecture videos or provide feedback on Aspire Mountain Academy's website.
Transcripts
Browse More Related Video

Finding the sample size needed to estimate a confidence interval on a population mean

Math 14 HW 6.4.6-T Using the Central Limit Theorem

Finding a confidence interval given summary sample data

Finding degrees of freedom, critical values, and a standard deviation confidence interval estimate

Math 14 HW 6.4.5-T Using the Central Limit Theorem

Finding the best point estimate and confidence interval for proportions
5.0 / 5 (0 votes)
Thanks for rating: