Finding the value of the test statistic for hypothesis testing on proportions
TLDRProfessor Curtis from Aspire Mountain Academy offers a lesson on calculating the test statistic for hypothesis testing on proportions. The video addresses a claim that most adults would remove their online personal information if possible, with a survey of 591 adults showing that 60% would do so. Instead of manually calculating the test statistic, the professor demonstrates using StatCrunch, a statistical software, to efficiently find the result. By inputting the survey's summary statistics, the software computes the test statistic, which is the focus of the demonstration. The professor emphasizes the ease of using technology to avoid complex calculations and invites viewers to provide feedback or learn more at Aspire Mountain Academy.
Takeaways
- 📚 Professor Curtis from Aspire Mountain Academy is providing statistics homework help on finding the value of the test statistic for hypothesis testing on proportions.
- 🎯 The claim is that most adults would erase their personal information online if possible, based on a survey by a software firm.
- 🔢 The survey included 591 randomly selected adults, with 60% indicating they would erase their information online.
- 🧮 To find the test statistic, Professor Curtis uses technology, specifically StatCrunch, to avoid manual calculations.
- 💻 In StatCrunch, the process involves selecting 'Stat', then 'Proportion Stats', followed by 'One Sample' and 'With Summary'.
- 📊 The number of successes is calculated by multiplying the total number of adults (591) by the percentage willing to erase their information (60%), resulting in 354.6, which is rounded to 355.
- 🌟 The total number of observations is the total number of adults surveyed, which is 591.
- ✅ The default settings in StatCrunch are used since the focus is on finding the test statistic, not the P-value.
- 🔑 After clicking 'Compute', the test statistic is found in the results window, rounded to two decimal places.
- 📈 The use of technology like StatCrunch is emphasized as a time-saving and efficient method for performing statistical calculations.
- 📝 Professor Curtis encourages viewers to provide feedback and comments on the video, and to visit aspiremountainacademy.com for more learning resources.
- 👋 The video concludes with an invitation to the next video, fostering a sense of ongoing learning and community.
Q & A
What is the main topic of the video?
-The main topic of the video is learning how to find the value of the test statistic for hypothesis testing on proportions.
Who is the speaker in the video?
-The speaker in the video is Professor Curtis from Aspire Mountain Academy.
What is the claim made in the problem statement?
-The claim is that most adults would erase all of their personal information online if they could.
What percentage of adults in the survey would erase their personal information online?
-According to the survey, 60% of the adults would erase their personal information online if they could.
How many adults were surveyed by the software firm?
-The software firm surveyed 591 randomly selected adults.
What tool does Professor Curtis use to calculate the test statistic?
-Professor Curtis uses StatCrunch to calculate the test statistic.
What is the first step in using StatCrunch for this problem?
-The first step is to click on 'Stat', go down to 'Proportion Stats', select 'One Sample', and then choose 'With Summary'.
How does Professor Curtis calculate the number of successes from the problem statement?
-Professor Curtis calculates the number of successes by multiplying 60% by the total number of adults surveyed, which is 591.
Why does Professor Curtis round the calculated number of successes to the nearest whole number?
-Professor Curtis rounds the number to the nearest whole number because it is not possible to have a fraction of a person in the context of survey responses.
What is the total number of observations used in the StatCrunch calculation?
-The total number of observations used is the total number of adults surveyed, which is 591.
What does Professor Curtis want to avoid by using StatCrunch?
-Professor Curtis wants to avoid the old-school, manual calculation method by using StatCrunch.
What does Professor Curtis suggest for students who find their stats teacher unhelpful?
-Professor Curtis suggests visiting aspiremountainacademy.com for lecture videos and additional resources to learn statistics.
Outlines
📚 Introduction to Hypothesis Testing on Proportions
Professor Curtis from Aspire Mountain Academy introduces the topic of finding the test statistic for hypothesis testing on proportions. The video aims to solve a problem statement that involves a claim about adults' willingness to erase their personal information online. The professor mentions a survey conducted by a software firm with 591 adults, where 60% indicated they would remove their data if possible. The main objective is to determine the value of the test statistic using technology, specifically StatCrunch, to avoid manual calculations.
Mindmap
Keywords
💡Hypothesis Testing
💡Proportions
💡Test Statistic
💡StatCrunch
💡Sample
💡Successes
💡Total Observations
💡Proportion Calculation
💡Rounding
💡Null Hypthesis
💡P-value
💡Online Privacy
Highlights
Professor Curtis from Aspire Mountain Academy provides statistics homework help on finding the test statistic for hypothesis testing on proportions.
The claim is that most adults would erase their personal information online if possible.
A survey by a software firm of 591 randomly selected adults showed that 60% would prefer to erase their online personal information.
The task is to find the value of the test statistic using a software tool instead of manual calculations.
StatCrunch software is used to calculate the test statistic, avoiding complex manual calculations.
The process begins by calculating the number of successes based on the survey results.
60% of 591 adults is calculated to find the number of successes, which is approximately 355 when rounded to the nearest whole number.
The total number of observations from the survey is 591.
Default settings in StatCrunch are used as they are sufficient for obtaining the test statistic.
The test statistic is the primary focus, not the P-value.
After clicking 'Compute' in StatCrunch, the test statistic is found in the results window.
The test statistic is rounded to two decimal places for accuracy.
Professor Curtis encourages feedback and comments to improve the learning experience.
Aspire Mountain Academy offers lecture videos and a platform for students to learn statistics.
The video concludes with an invitation to visit aspiremountainacademy.com for more learning resources.
The importance of engaging with the content and seeking help when needed is emphasized.
The video provides a practical example of using technology to simplify statistical analysis.
The demonstration shows how to navigate through StatCrunch for statistical analysis.
A step-by-step guide on using StatCrunch for hypothesis testing on proportions is provided.
Transcripts
Browse More Related Video
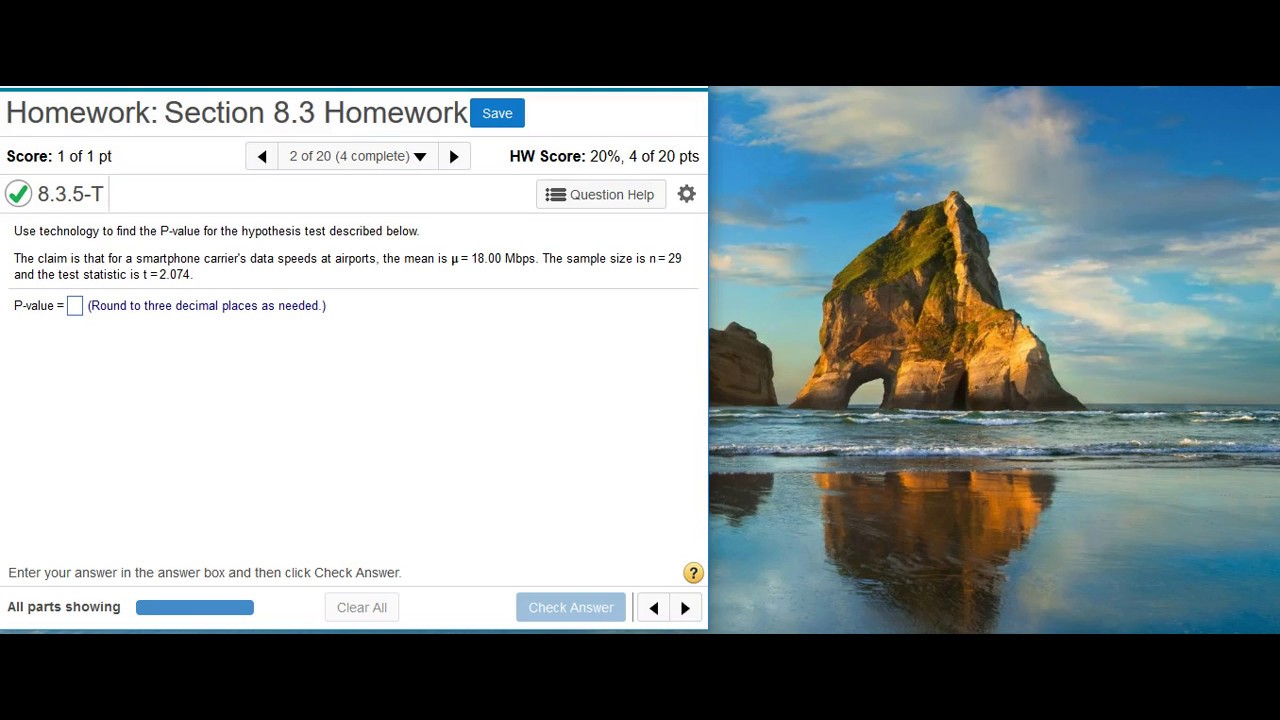
Finding a P-value given the test statistic
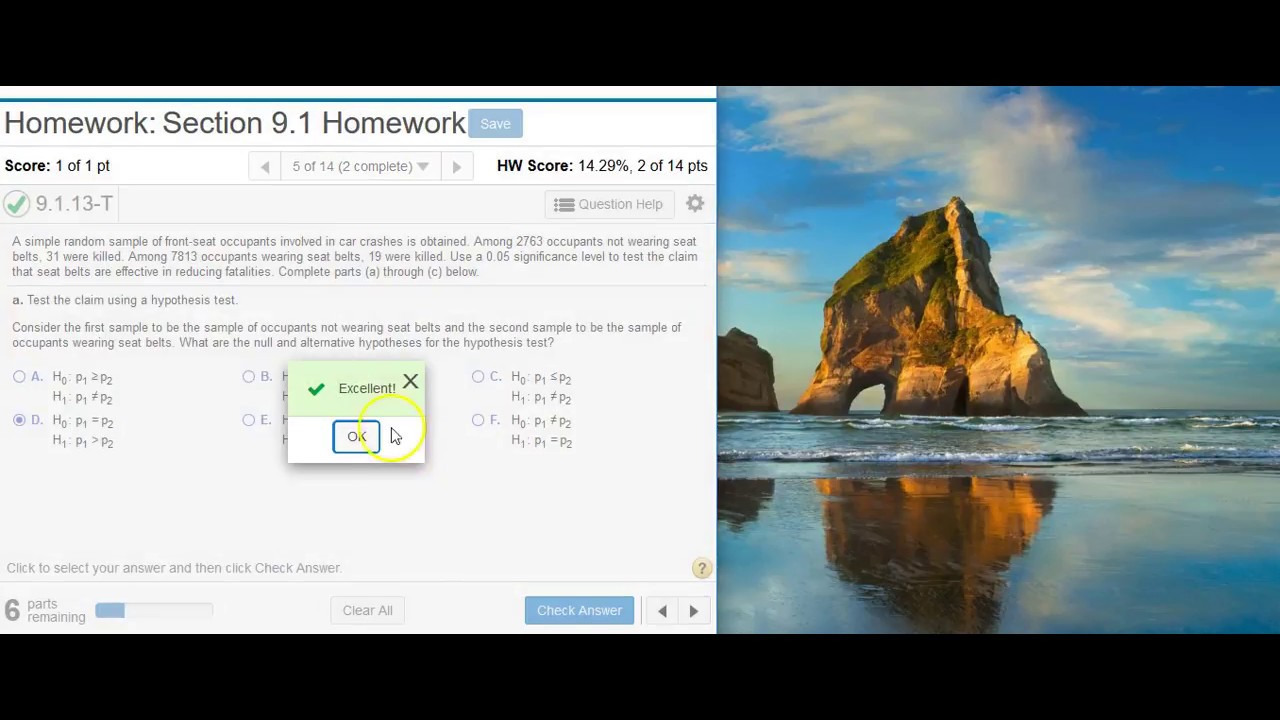
Performing hypothesis testing on two proportions in StatCrunch

Using StatCrunch to perform hypothesis testing on two proportions of referee calls
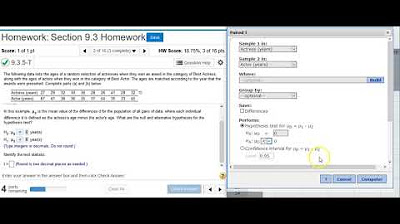
Using StatCrunch to perform hypothesis testing on two matched pair means of acting award ages
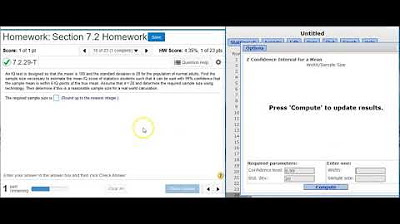
Finding the sample size needed to estimate a confidence interval on a population mean

Finding The Test Statistic For a Hypothesis Test Using StatCrunch
5.0 / 5 (0 votes)
Thanks for rating: