7.1.5 Estimating a Population Proportion - Given a Confidence Interval, Find p Hat and E.
TLDRThis video tutorial explains how to calculate the point estimate of a population proportion (p-hat) and the margin of error (e) from a given confidence interval. It demonstrates the process through a real-world example involving a high-dose nicotine patch therapy study, showing how to find p-hat by averaging the upper and lower bounds of the interval and determining the error as half the interval's length. The example illustrates the application of these concepts in estimating the proportion of smokers abstinent after therapy, providing a clear understanding of confidence intervals and their practical use in statistical analysis.
Takeaways
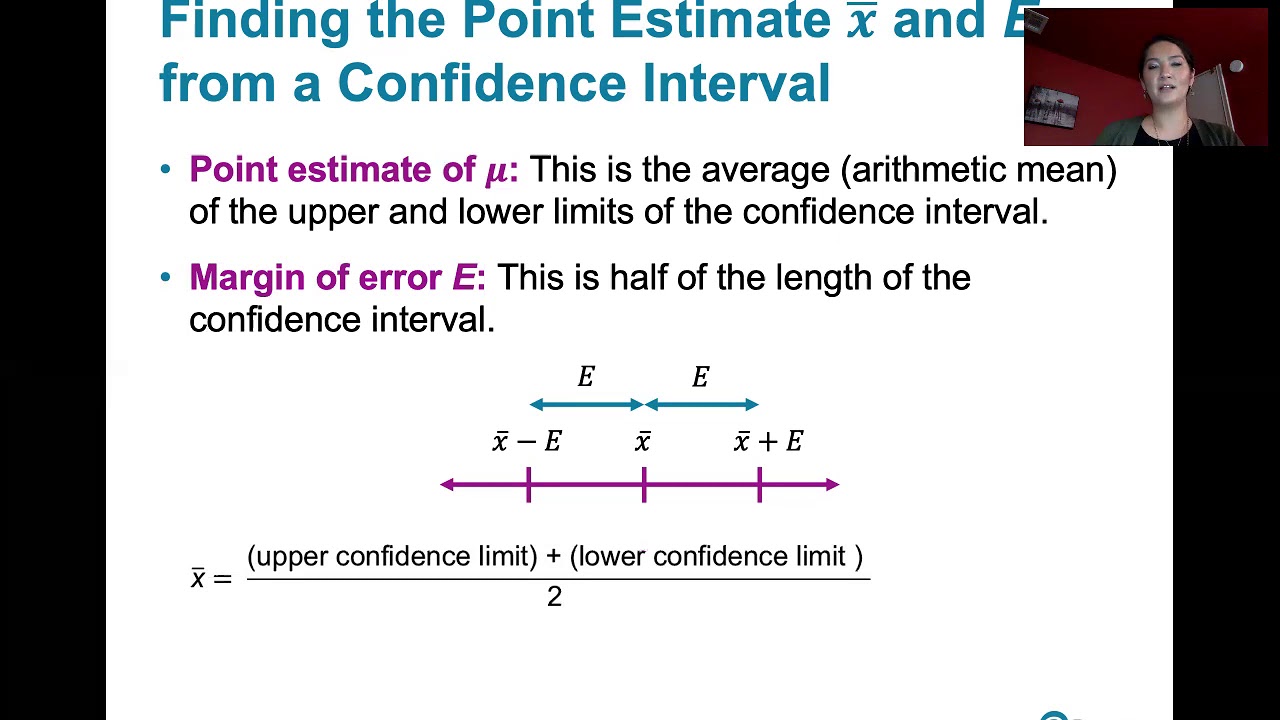
- 📊 The point estimate of p (p-hat) is the average of the upper and lower limits of a confidence interval.
- 📈 To find p-hat, add the upper and lower limits of the confidence interval and divide by 2.
- 🔍 The margin of error (e) can be found by subtracting p-hat from the upper limit or by dividing the interval length by 2.
- 📐 The length of the confidence interval is twice the margin of error.
- 🚫 The margin of error is not the same as the confidence interval itself; it is half of the interval's length.
- 📝 In the given example, the point estimate p-hat is 0.695, calculated from the 95% confidence interval of 0.58 to 0.81.
- 🔢 The margin of error e, in the example, is 0.115, derived from the difference between the upper and lower bounds of the interval.
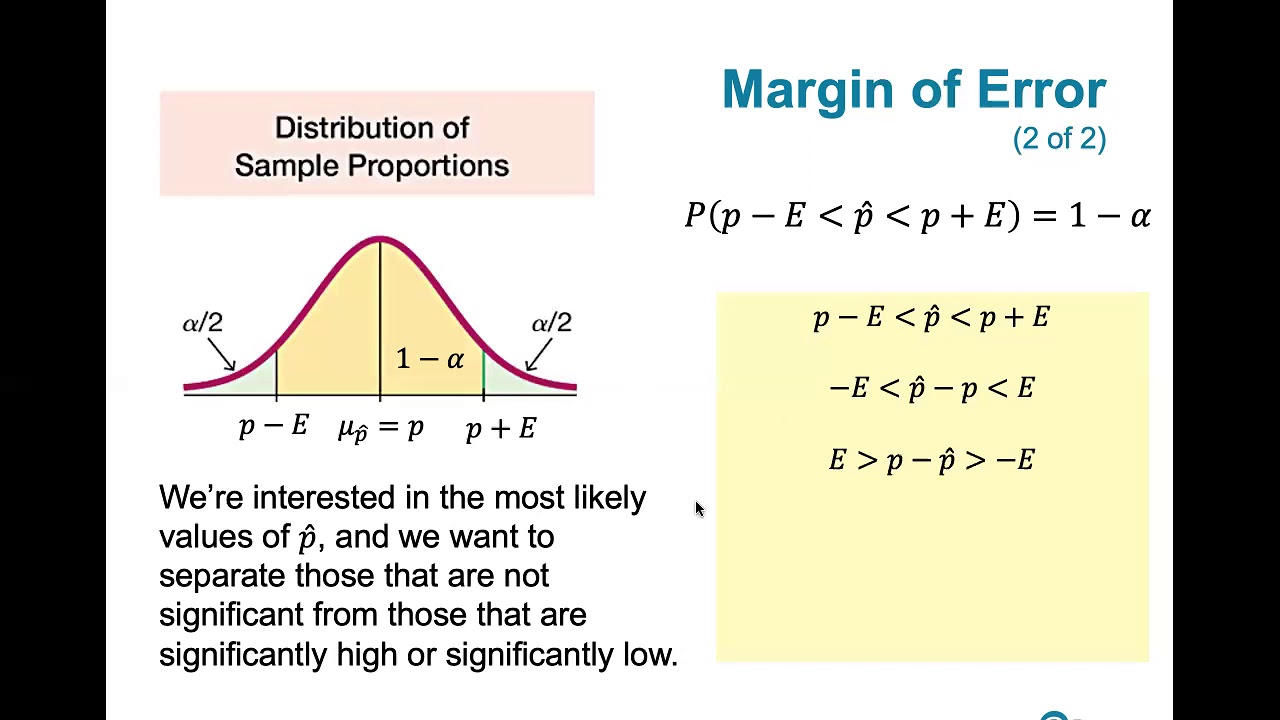
- 🌐 The confidence interval provides a range within which the true population proportion is likely to fall, with a certain level of confidence (95% in the example).
- 🔄 The process of finding p-hat and e is essential for understanding the precision of an estimate in statistical analysis.
- 📚 The example from the 'Journal of the American Medical Association' demonstrates the application of these concepts in a real-world study.
- 🔑 Understanding how to calculate p-hat and the margin of error is crucial for interpreting the results of confidence intervals in research.
Q & A
What is the main topic discussed in the video?
-The main topic discussed in the video is how to find the point estimate of a population proportion (p-hat) and the margin of error (e) when given a confidence interval.
What is the definition of a point estimate of a population proportion?
-A point estimate of a population proportion is the average or arithmetic mean of the upper and lower limits of a confidence interval.
How can you find the point estimate p-hat from a confidence interval?
-To find p-hat, you take the average of the upper and lower limits of the confidence interval by adding them together and dividing by two.
What is the formula to calculate the margin of error e from a confidence interval?
-The margin of error e can be calculated by taking the length of the confidence interval (upper limit minus lower limit) and dividing it by two.
How does the length of the confidence interval relate to the margin of error?
-The length of the confidence interval is twice the margin of error. Therefore, to find the margin of error, you divide the interval length by two.
What is an example of a point estimate given in the video?
-An example of a point estimate given in the video is 70 out of 71 subjects being abstinent from smoking after a high-dose nicotine patch therapy.
What is the purpose of a confidence interval in statistical analysis?
-A confidence interval in statistical analysis provides a range of values that is likely to contain the true population parameter with a certain level of confidence, such as 95%.
What is the confidence level mentioned in the example from the video?
-The confidence level mentioned in the example is 95%, which means there is a 95% chance that the true population proportion lies within the interval.
How is the point estimate p-hat calculated in the example provided in the video?
-In the example, p-hat is calculated by taking the average of the lower bound (0.58) and the upper bound (0.81) of the confidence interval, which results in 0.695.
What is the margin of error e found in the example from the video?
-The margin of error e in the example is found by subtracting p-hat (0.695) from the upper limit (0.81), resulting in 0.115.
How can you express the confidence interval in terms of p-hat and the margin of error?
-The confidence interval can be expressed as p-hat plus or minus the margin of error, which gives you the range within which the true population proportion is estimated to lie.
Outlines
📊 Understanding Point Estimate and Margin of Error
This paragraph introduces the concept of finding the point estimate, denoted as p-hat, and the margin of error, e, from a given confidence interval for a population proportion. It explains that the point estimate is the arithmetic mean of the upper and lower limits of the confidence interval. The paragraph also discusses two methods to find the margin of error: by subtracting p-hat from the upper limit or by dividing the interval's length by two. An example from a study on nicotine patch therapy is used to illustrate these concepts, showing how to calculate p-hat and the margin of error using the provided confidence interval.
🔢 Calculating Point Estimate and Error with Confidence Interval
The second paragraph delves deeper into the calculation of the point estimate and margin of error using the confidence interval from the nicotine patch therapy study. It demonstrates the process of finding the point estimate by averaging the upper and lower bounds of the interval, resulting in 0.695 or 69.5%. The margin of error is then calculated by subtracting the point estimate from the upper limit or by dividing the interval's length by two, yielding 0.115 or 11.5%. The paragraph emphasizes the importance of these calculations in estimating the population proportion with a certain degree of confidence.
🔚 Wrapping Up the Explanation of Confidence Intervals
The final paragraph concludes the video's discussion on finding the point estimate and margin of error from a confidence interval. It summarizes the process and reiterates the importance of these statistical measures. The paragraph also teases the next topic, which is finding the appropriate sample size, to be discussed in a subsequent video. This sets the stage for further statistical exploration and understanding.
Mindmap
Keywords
💡Point Estimate
💡Margin of Error
💡Confidence Interval
💡Population Proportion
💡Arithmetic Mean
💡Sample Size
💡Abstinent
💡Therapy
💡Nicotine Patch
💡Journal of the American Medical Association
Highlights
The video discusses learning outcome number five from lesson 7.1, focusing on finding the point estimate (p-hat) and margin of error (e) for a population proportion given a confidence interval.
A point estimate of p is the average or arithmetic mean of the upper and lower limits of a confidence interval.
To find p-hat, graph the interval and calculate its center, which represents the point estimate.
The margin of error can be found by subtracting p-hat from the upper limit or by dividing the interval's length by two.
The length of the confidence interval is twice the margin of error.
An example from the article 'High dose nicotine patch therapy' in the Journal of the American Medical Association is used to illustrate the process.
In the example, 70 out of 71 subjects were abstinent from smoking for eight weeks after nicotine patch therapy, indicating a high success rate.
A 95% confidence interval for the true proportion of subjects abstinent from smoking is given as 58% to 81%.
The point estimate p-hat is calculated to be 0.695, consistent with the example's success rate.
The margin of error e is calculated to be 0.115, indicating a potential 11.5% deviation from the point estimate.
The video demonstrates two methods for finding the margin of error, both yielding the same result.
The confidence interval can be expressed in the form p-hat ± e, providing a range of values for estimating the population proportion.
The video emphasizes the importance of understanding confidence intervals for making accurate statistical inferences.
The example illustrates the practical application of confidence intervals in medical research, specifically in smoking cessation studies.
The video concludes by summarizing the steps to find p-hat and the error from a given confidence interval.
The next video will discuss finding the appropriate sample size for statistical analysis.
Transcripts
Browse More Related Video
7.2.3 Estimating a Population Mean - Finding X-Bar and Margin of Error, Given a Confidence Interval
7.1.4 Estimating a Population Proportion - Margin of Error and Computing Confidence Intervals

Confidence Interval for a population proportion | Solved Problems
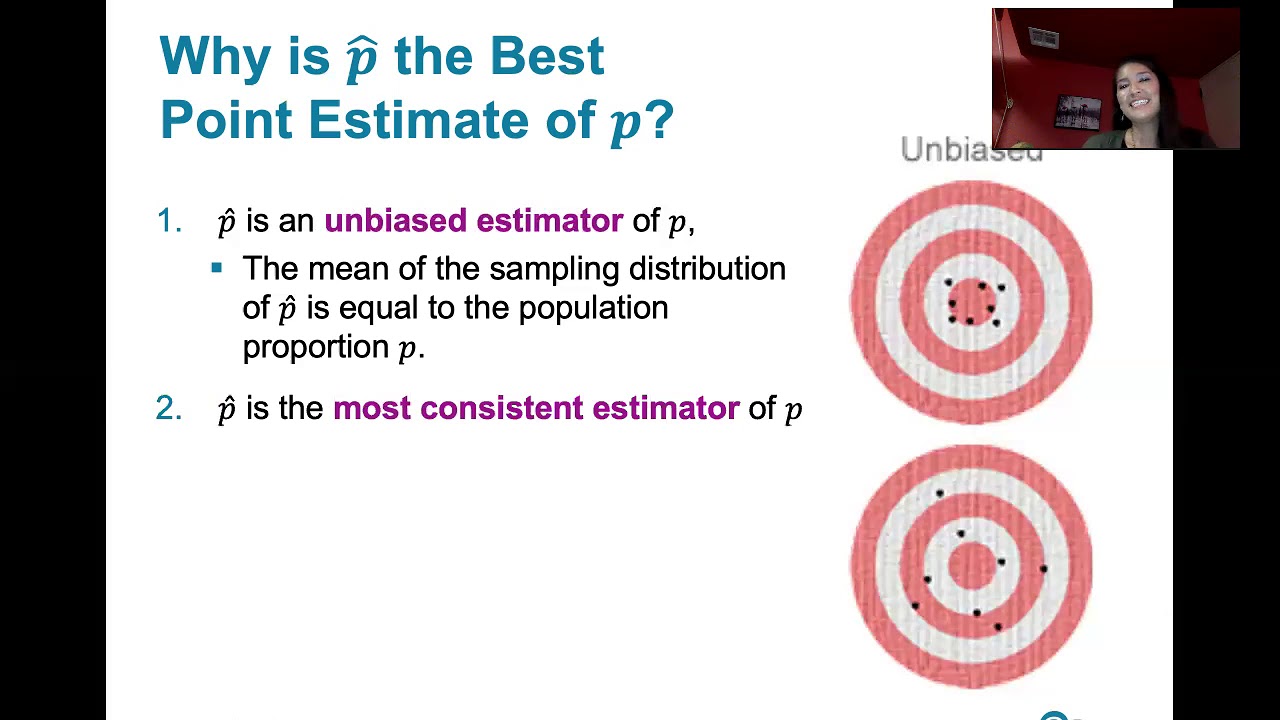
7.1.1 Estimating a Population Proportion - The Best Point Estimate, Our Sample Proportion p-Hat
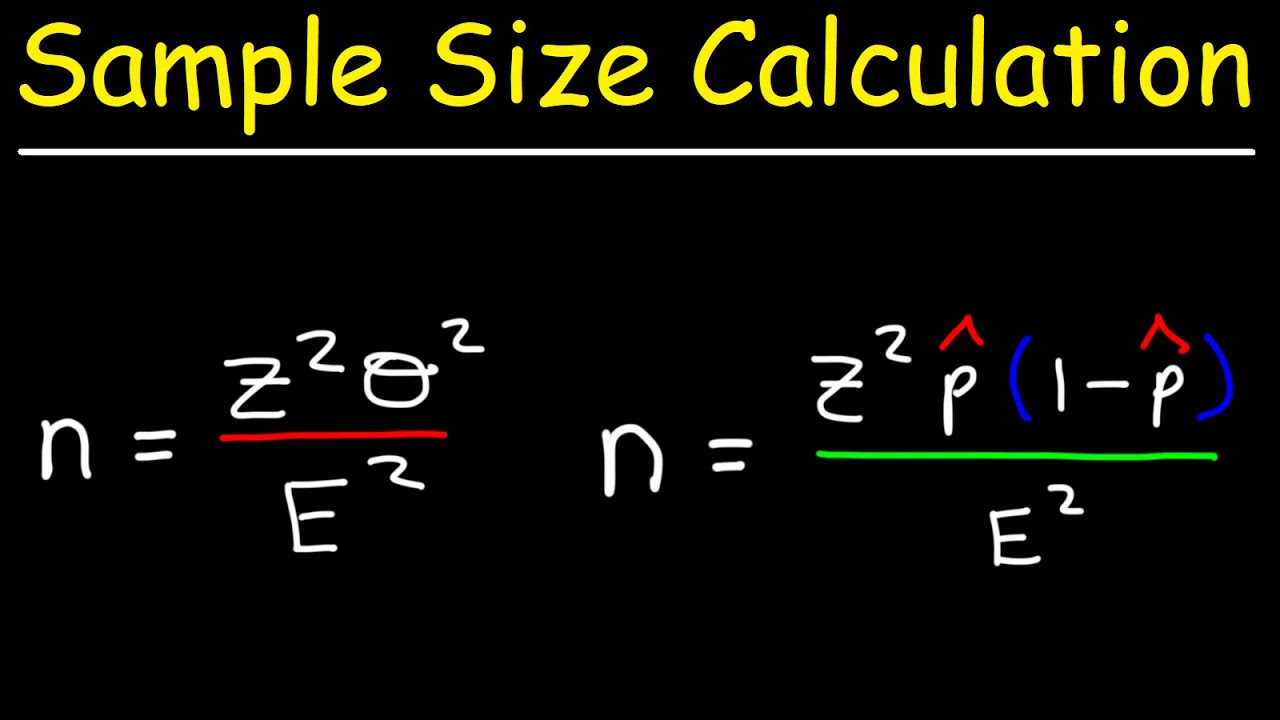
How To Calculate The Sample Size Given The Confidence Level & Margin of Error

Elementary Stats Lesson #15
5.0 / 5 (0 votes)
Thanks for rating: