7.2.3 Estimating a Population Mean - Finding X-Bar and Margin of Error, Given a Confidence Interval
TLDRThis video tutorial explains how to determine the margin of error and the point estimate for a population mean, given a confidence interval. It clarifies that the point estimate is the sample mean, found by averaging the upper and lower limits of the interval. The margin of error is half the interval's length, calculated by subtracting the lower limit from the upper and dividing by two. An example illustrates the process using a 90% confidence interval for weight loss, where the sample mean and margin of error are calculated to be 2.1 pounds and 1.3 pounds, respectively.
Takeaways
- 📚 The script discusses how to find the margin of error and point estimate for a population mean given a confidence interval.
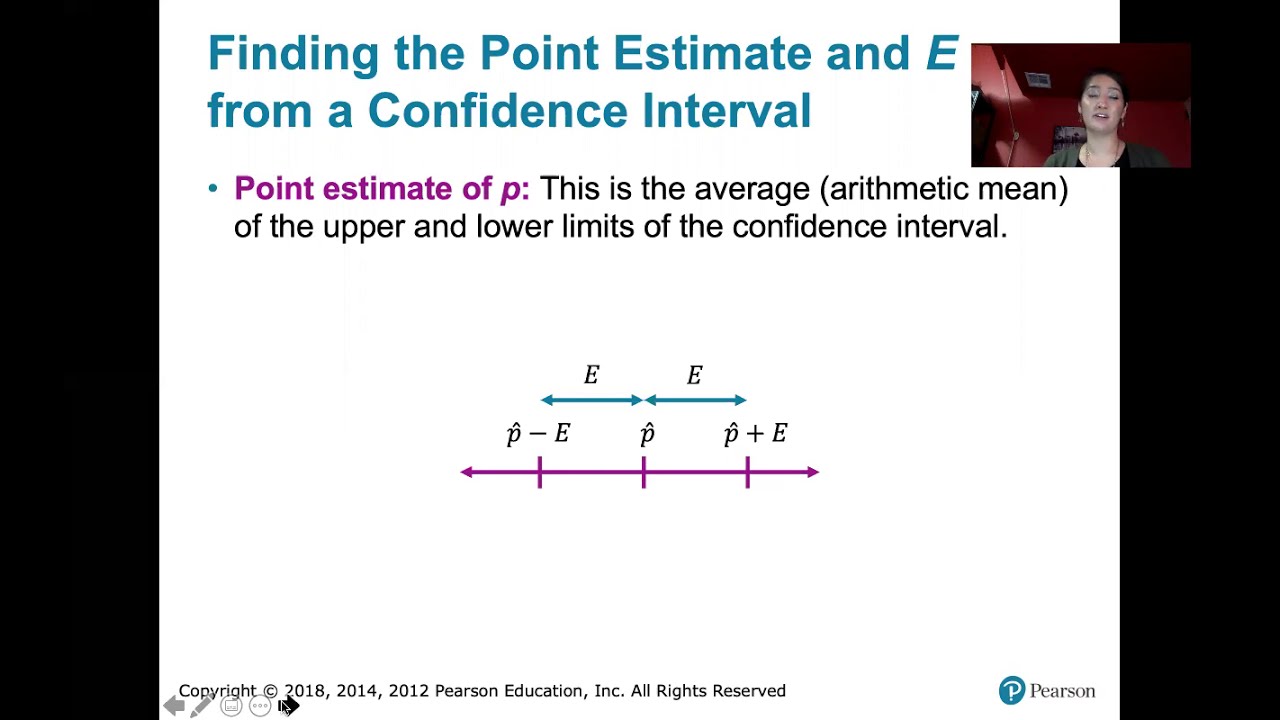
- 🔍 The point estimate of the population mean is the sample mean, calculated as the average of the upper and lower limits of the confidence interval.
- 📉 To find the point estimate, add the upper and lower limits of the confidence interval and divide by two.
- 📈 The margin of error is the distance from the sample mean to the confidence interval limits, and it can be found by taking half the interval's length.
- 📝 The script explains that the confidence interval is computed by adding and subtracting the margin of error from the sample mean.
- 🧐 The confidence level, such as 90%, indicates the probability that the true population mean lies within the interval.
- 🤔 The script uses an example of a weight loss program to illustrate how to calculate the sample mean and margin of error from a given confidence interval.
- 📊 In the example, the 90% confidence interval for mean weight loss is between 0.8 and 3.4 pounds, suggesting the true mean lies within this range.
- ⚖️ The sample mean weight loss for the 40 adults in the study is calculated to be 2.1 pounds after one year.
- 📐 The margin of error for the confidence interval is found to be 1.3 pounds, which is half the difference between the upper and lower limits.
- 🔄 The script emphasizes that the margin of error can be verified by subtracting the lower limit from the upper limit and dividing by two.
Q & A
What is the main topic of the video?
-The main topic of the video is explaining how to find the margin of error and the point estimate, specifically the sample mean (x bar), for a population mean given a confidence interval.
What is the point estimate of the population mean?
-The point estimate of the population mean is the sample mean, which is the average of the upper and lower limits of the confidence interval.
How is the sample mean calculated from the confidence interval?
-The sample mean is calculated by taking the arithmetic mean of the upper and lower limits of the confidence interval, which is done by adding the two limits and dividing by two.
What is the margin of error in the context of a confidence interval?
-The margin of error is the distance from the sample mean to either the upper or lower limit of the confidence interval. It represents the range within which the true population mean is likely to fall.
How can you find the margin of error given the confidence interval limits?
-To find the margin of error, subtract the lower limit from the upper limit of the confidence interval, and then divide the result by two to get half the length of the interval.
What does the video mention about the confidence level of the weight loss program study?
-The video mentions a 90% confidence level for the weight loss program study, meaning that if the study were repeated 100 times, the true population mean would be contained within the confidence interval in 90 of those instances.
What was the confidence interval estimate for the mean weight loss after 12 months in the Atkins weight loss program study?
-The 90% confidence interval estimate for the mean weight loss after 12 months in the Atkins weight loss program study was between 0.8 pounds and 3.4 pounds.
How much was the mean weight loss for the 40 adults in the Atkins weight loss program study after one year?
-The mean weight loss for the 40 adults in the study after one year was 2.1 pounds.
What is the margin of error for the weight loss confidence interval in the Atkins weight loss program study?
-The margin of error for the weight loss confidence interval in the study is 1.3 pounds.
How can you verify the margin of error calculation?
-You can verify the margin of error calculation by checking that the distance from the sample mean to the upper limit plus the distance from the sample mean to the lower limit equals twice the margin of error.
What does the 90% confidence interval suggest about the true population mean for the Atkins weight loss program?
-The 90% confidence interval suggests that we can be 90% confident that the true population mean for the Atkins weight loss program lies between 0.8 pounds and 3.4 pounds of weight loss after 12 months.
Outlines
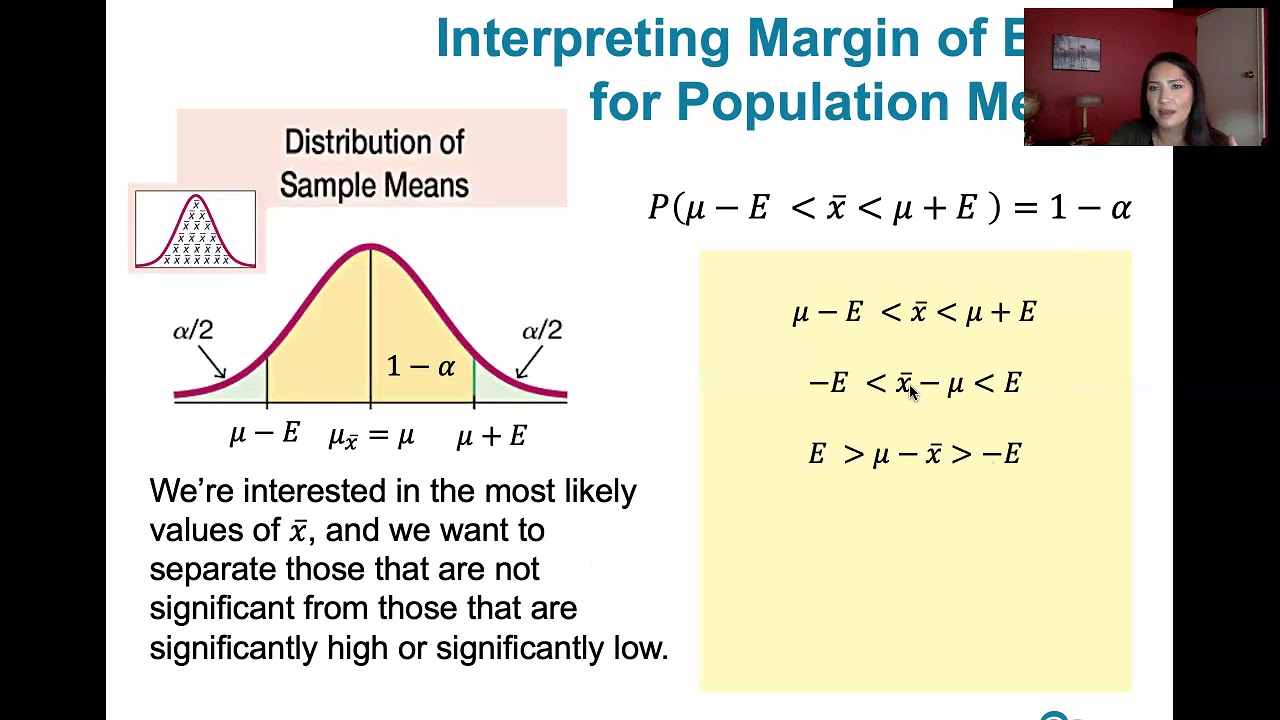
📊 Understanding Confidence Intervals and Margin of Error
This paragraph introduces the concept of finding the margin of error and point estimate, x-bar, for a population mean given a confidence interval. It explains that the point estimate is the sample mean, which is the average of the upper and lower limits of the confidence interval. The margin of error is calculated by taking half the length of the interval, which is the distance between the upper and lower limits. The paragraph uses an example of a weight loss program study to illustrate these calculations, showing how to find the sample mean and margin of error from a 90% confidence interval for mean weight loss.
✂️ Calculating the Margin of Error with Confidence
The second paragraph builds on the previous discussion by providing alternative methods to calculate the margin of error. It emphasizes that the margin of error can be verified by subtracting the sample mean from the upper limit and then from the lower limit, both yielding the same result. This reinforces the concept that the margin of error is the distance from the sample mean to either the upper or lower limit of the confidence interval, and it confirms the accuracy of the calculations by showing that different approaches lead to the same outcome.
Mindmap
Keywords
💡Margin of Error
💡Point Estimate
💡Confidence Interval
💡Sample Mean (x̄)
💡Arithmetic Mean
💡Population Mean
💡Weight Loss Program
💡Confidence Level
💡Upper Limit
💡Lower Limit
💡Interval Length
Highlights
The video discusses how to find the margin of error and point estimate for a population mean given a confidence interval.
The point estimate of the population mean is the sample mean, calculated as the average of the upper and lower limits of the confidence interval.
The margin of error is found by taking half the length of the confidence interval, which is the distance between the upper and lower limits.
The sample mean (x bar) is the midpoint between the confidence interval limits, found by averaging them.
The margin of error can also be calculated by subtracting the lower limit from the upper limit of the confidence interval and dividing by 2.
A 90% confidence interval for the mean weight loss after 12 months on the Atkins diet was found to be between 0.8 and 3.4 pounds.
The 90% confidence level means that if the intervals were created 100 times, 90 of them would contain the true population mean.
The sample mean weight loss for the 40 adults on the Atkins diet was calculated to be 2.1 pounds after 12 months.
The margin of error for the weight loss confidence interval was found to be 1.3 pounds.
The margin of error can be verified by subtracting the sample mean from the upper and lower limits of the interval.
The video provides a step-by-step explanation of how to calculate the sample mean and margin of error from a confidence interval.
The process involves understanding the relationship between the sample mean, margin of error, and the confidence interval limits.
The video emphasizes the importance of correctly interpreting confidence intervals and their implications for statistical analysis.
The example of the Atkins diet weight loss study demonstrates the application of these concepts in a real-world context.
The video clarifies common misconceptions about calculating the sample mean and margin of error from a confidence interval.
The method presented is applicable to any confidence interval, not just the specific example given in the video.
Transcripts
Browse More Related Video
7.1.5 Estimating a Population Proportion - Given a Confidence Interval, Find p Hat and E.
7.2.2 Estimating a Population Mean - Sample Mean, Margin of Error, and Finding Confidence Intervals
How To Find The Z Score, Confidence Interval, and Margin of Error for a Population Mean

Confidence interval example | Inferential statistics | Probability and Statistics | Khan Academy

Confidence Interval for a population proportion | Solved Problems
Confidence Interval for a population mean - t distribution
5.0 / 5 (0 votes)
Thanks for rating: