7.1.1 Estimating a Population Proportion - The Best Point Estimate, Our Sample Proportion p-Hat
TLDRThis video script delves into the concept of point estimates, particularly focusing on estimating a population proportion using the sample proportion (p-hat). It explains that p-hat is an unbiased and consistent estimator, with its mean in the sampling distribution equal to the population proportion. The script illustrates how to calculate p-hat with an example from McDonald's drive-through order accuracy, concluding that the best point estimate of inaccurate orders is about 9.1%. The discussion sets the stage for further exploration of confidence intervals to assess the precision of point estimates.
Takeaways
- 📊 A point estimate is a single value used to estimate a population parameter, such as the sample proportion (\(\hat{p}\)) for the population proportion \(p\)).
- 📈 The sample proportion (\(\hat{p}\)) is considered the best point estimate of the population proportion \(p\) due to its properties and the central limit theorem.
- 🔢 Other point estimates include the sample mean (\(\bar{x}\)) for the population mean (\(\mu\)), and the sample standard deviation (\(s\)) for the population standard deviation (\(\sigma\)).
- 🌐 The concept of point estimates extends to various sample statistics, each estimating a corresponding population parameter.
- 📚 The script revisits sampling distributions from chapter six, highlighting that the distribution of sample proportions tends to be normally distributed with a mean equal to the population proportion.
- 🎯 An unbiased estimator is one where the mean of its sampling distribution equals the population parameter it estimates, making \(\hat{p}\) an unbiased estimator of \(p\).
- 📉 The standard deviation of the sampling distribution of \(\hat{p}\) is smaller than that of other unbiased estimators, indicating \(\hat{p}\) is more consistent and has less variation.
- 🔄 The script uses the example of a politician's approval rating to illustrate how percentages, proportions, and probabilities are interchangeable and represent the same point estimate.
- 📝 The calculation of \(\hat{p}\) is demonstrated with a McDonald's drive-through order accuracy example, resulting in an estimated inaccuracy proportion of approximately 9.1%.
- 🤔 The script acknowledges that point estimates like \(\hat{p}\) are subject to variation and may not always perfectly reflect the true population proportion, hinting at the need for confidence intervals.
- 📈 The discussion on point estimates sets the stage for further exploration of confidence intervals in subsequent lessons, which will provide a measure of the estimate's precision.
Q & A
What is a point estimate and why is it used?
-A point estimate is a single value used to estimate a population parameter. It's used because it provides a simple and direct way to infer characteristics about a larger population based on sample data.
What is the sample proportion and how is it related to the population proportion?
-The sample proportion (p-hat) is the ratio of the number of successes to the total number of observations in a sample. It serves as a point estimate for the population proportion (p), which is the true ratio of successes in the entire population.
Why is the sample proportion considered the best point estimate of the population proportion?
-The sample proportion is considered the best point estimate because its sampling distribution tends to have a mean equal to the population proportion, making it an unbiased estimator. Additionally, it has the smallest standard deviation among unbiased estimators, indicating greater consistency.
How can percentages, proportions, and probabilities be used interchangeably?
-Percentages, proportions, and probabilities can be used interchangeably because they all represent the same underlying ratio or frequency. A percentage can be converted to a probability by dividing by 100, and vice versa, a probability can be converted to a percentage by multiplying by 100.
What is the concept of an unbiased estimator in the context of point estimates?
-An unbiased estimator is a statistic that, over many samples, has a mean equal to the population parameter it is estimating. In other words, it does not systematically overestimate or underestimate the parameter.
How does the concept of consistency relate to point estimates?
-Consistency in point estimates refers to the property where the standard deviation of the sampling distribution of the estimator tends to be smaller than that of other unbiased estimators. This means that consistent estimators have less variation and are more likely to be closer to the actual population parameter.
What is a sampling distribution and why is it important?
-A sampling distribution is the probability distribution of a given statistic based on a random sample. It is important because it allows us to understand the variability of sample statistics and to make inferences about the population parameters.
How is the sample proportion calculated?
-The sample proportion (p-hat) is calculated by dividing the number of successes in the sample by the total number of observations in the sample.
Can you provide an example of calculating the sample proportion from the script?
-Yes, in the script, an example is given where McDonald's had 33 inaccurate orders out of 362 orders. The sample proportion of inaccurate orders is calculated as 33 divided by 362, which is approximately 0.091 or 9.1%.
What is the significance of the normal distribution in the context of the sampling distribution of the sample proportion?
-The significance of the normal distribution in the context of the sampling distribution of the sample proportion is that it allows us to make inferences about the population proportion. The mean of this normal distribution is equal to the population proportion, which validates the use of the sample proportion as an unbiased estimator.
What is the next step after calculating a point estimate?
-The next step after calculating a point estimate is often to determine a confidence interval. Confidence intervals provide a range around the point estimate that is likely to contain the population parameter with a certain level of confidence.
Outlines
📊 Introduction to Point Estimates and Sample Proportion
This paragraph introduces the concept of point estimates in statistics, focusing on the population proportion. It explains what a point estimate is—a single value used to estimate a population parameter—and provides examples such as the sample proportion (p-hat), sample mean (x-bar), and sample standard deviation (s). The paragraph emphasizes that the sample proportion is considered the best point estimate for the population proportion (p) and sets the stage for a deeper discussion on why this is the case. The narrative includes examples of how a politician's approval rating can be represented as a sample proportion, probability, or percentage, highlighting the interchangeable nature of these terms.
📈 Sampling Distributions and the Unbiased Estimator
The second paragraph delves into the concept of sampling distributions, specifically the distribution of sample proportions (p-hats), and why they tend to have a normal distribution with a mean equal to the population proportion. It discusses the idea of an unbiased estimator, where the mean of the sampling distribution of the estimator (in this case, p-hat) is equal to the population parameter it estimates. The paragraph also introduces the concept of consistency, explaining that p-hat is more consistent than other unbiased estimators due to its smaller standard deviation in the sampling distribution, meaning it has less variation and is closer to the actual population proportion.
🔢 Calculation and Application of Sample Proportion
The final paragraph provides a practical example of calculating the sample proportion using data from a study about McDonald's drive-through order accuracy. It illustrates the process of computing p-hat by dividing the number of inaccurate orders by the total number of orders, resulting in an estimate of the proportion of inaccurate orders. The paragraph concludes by emphasizing that while p-hat is the best point estimate available from the sample data, further analysis with confidence intervals is necessary to assess the accuracy and reliability of this estimate. It also hints at the continuation of the topic in the next video, which will focus on confidence intervals.
Mindmap
Keywords
💡Point Estimate
💡Population Proportion
💡Sample Proportion
💡Sampling Distribution
💡Unbiased Estimator
💡Consistent Estimator
💡Probability
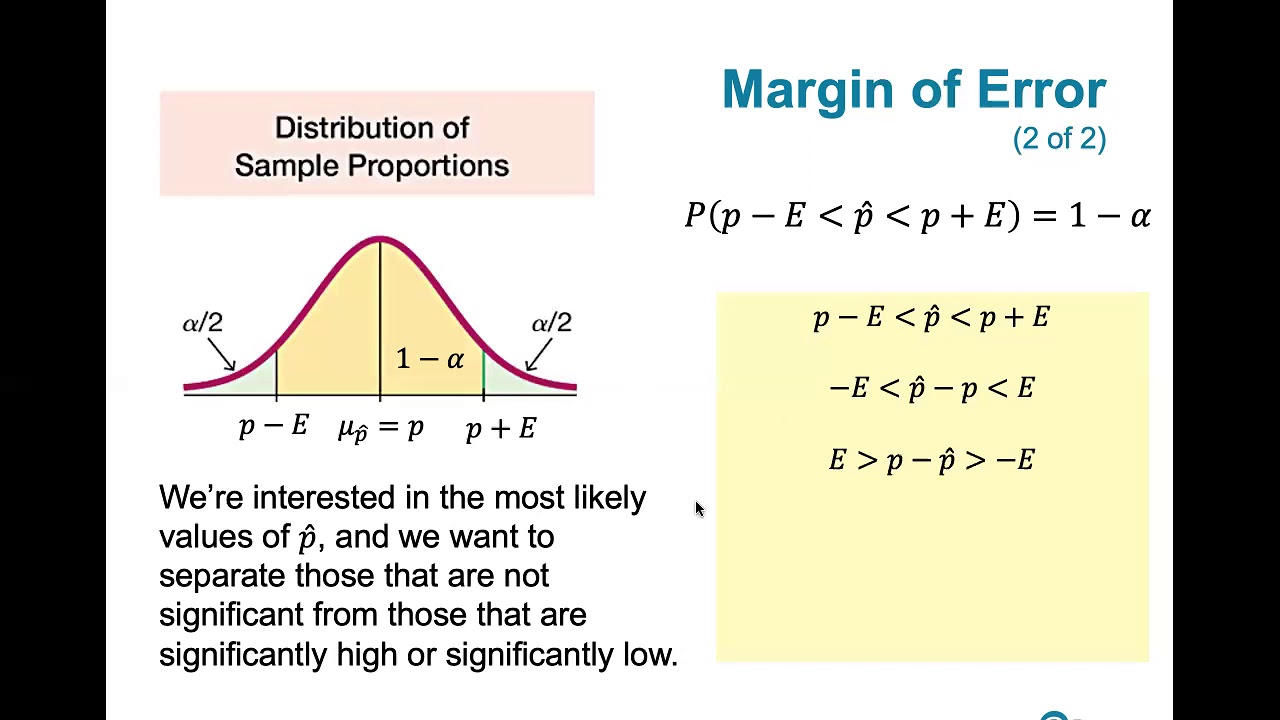
💡Margin of Error
💡Confidence Intervals
💡McDonald's Example
Highlights
A point estimate is defined as a single value used to estimate a population parameter.
The sample proportion (p-hat) is identified as the best point estimate of the population proportion (p).
Examples of point estimates include the sample proportion, sample mean, and sample standard deviation.
Point estimates are derived from sample statistics and are used to estimate corresponding population parameters.
The sample proportion can be expressed as a percentage, probability, or true proportion.
Percentages, proportions, and probabilities are interchangeable in representing the same sample data.
The sampling distribution of sample proportions tends to have a normal distribution with a mean equal to the population proportion.
P-hat is an unbiased estimator of p because its mean in the sampling distribution equals the population proportion.
An unbiased estimator is one where the mean of its sampling distribution is equal to the population parameter.
P-hat is described as targeting p, indicating that its mean is on target and values are centered around the population proportion.
P-hat is the most consistent estimator of p, with a smaller standard deviation in its sampling distribution compared to other unbiased estimators.
Consistency in an estimator means less variation around the mean, making it closer to the actual population parameter.
The process of computing p-hat is demonstrated using a McDonald's drive-through order accuracy study.
The point estimate of the proportion of inaccurate McDonald's orders is calculated to be approximately 0.091.
The point estimate suggests that about 9.1 percent of McDonald's orders are not accurate based on the sample data.
While p-hat is the best point estimate, its accuracy may vary with different samples, highlighting the need for confidence intervals.
The discussion will continue with confidence intervals to assess the precision of point estimates like p-hat.
Transcripts
Browse More Related Video
7.1.4 Estimating a Population Proportion - Margin of Error and Computing Confidence Intervals
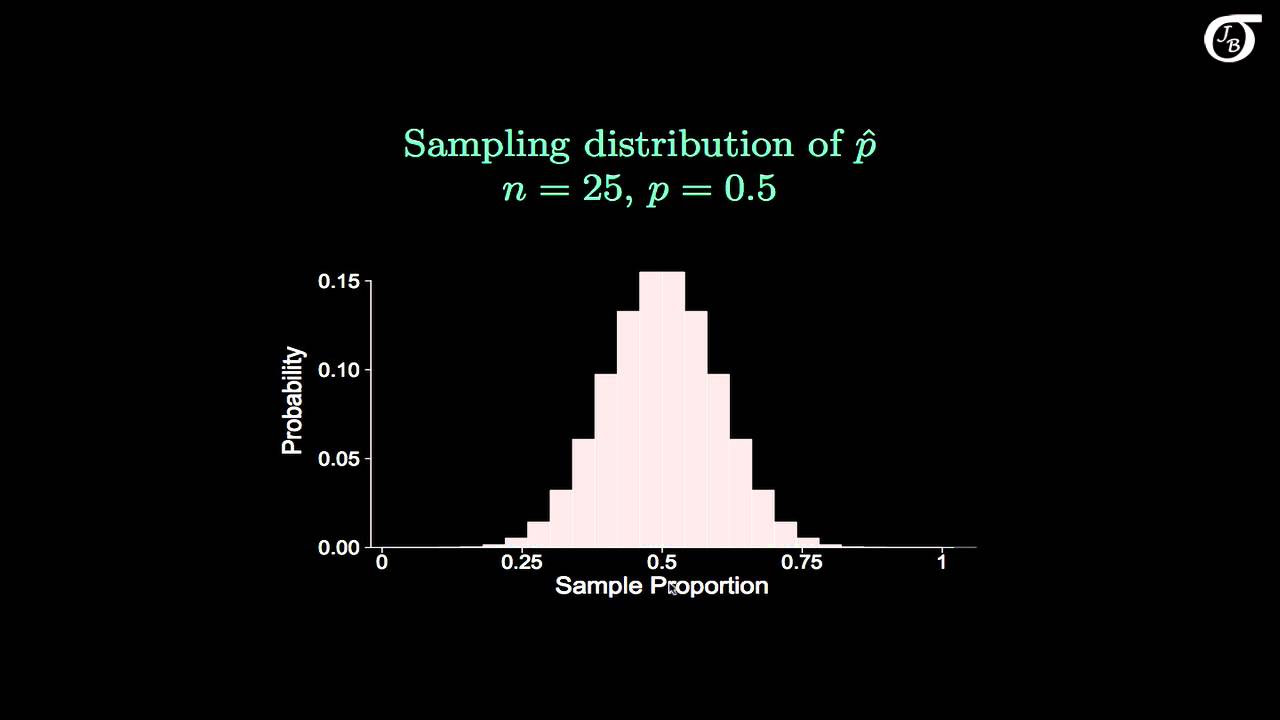
The Sampling Distribution of the Sample Proportion
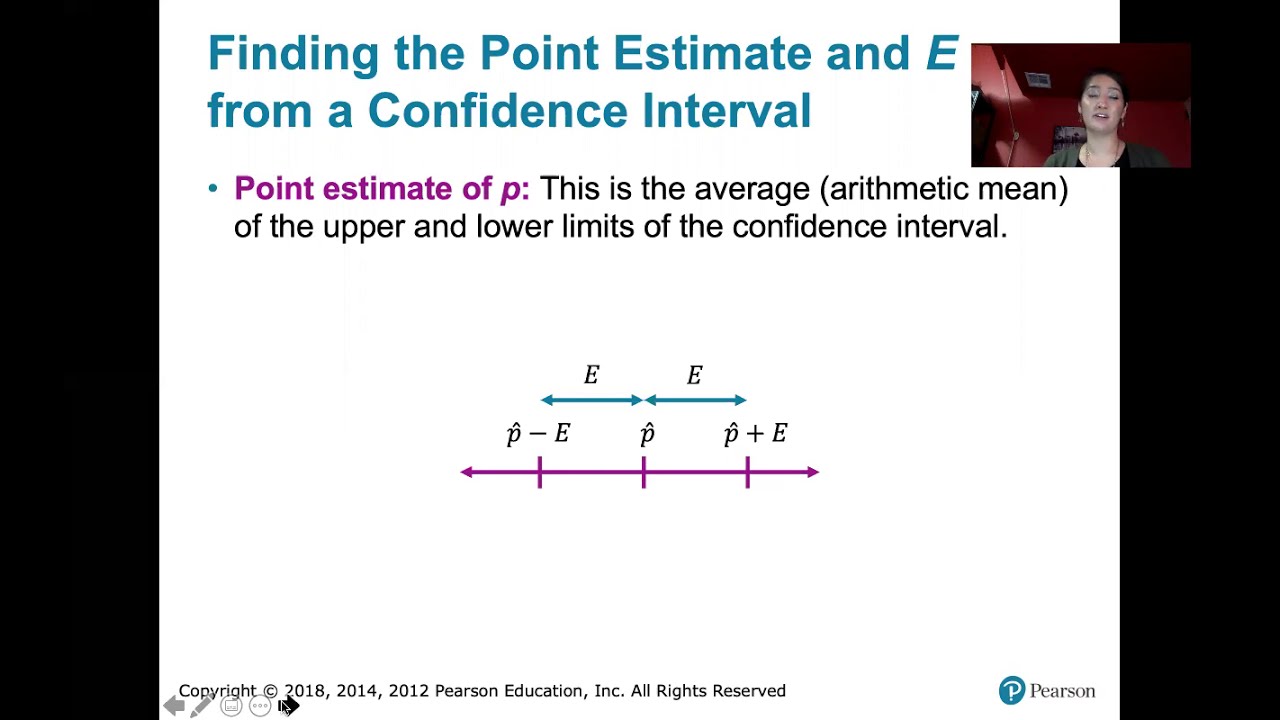
7.1.5 Estimating a Population Proportion - Given a Confidence Interval, Find p Hat and E.

Confidence Interval for a population proportion | Solved Problems

Elementary Stats Lesson #15
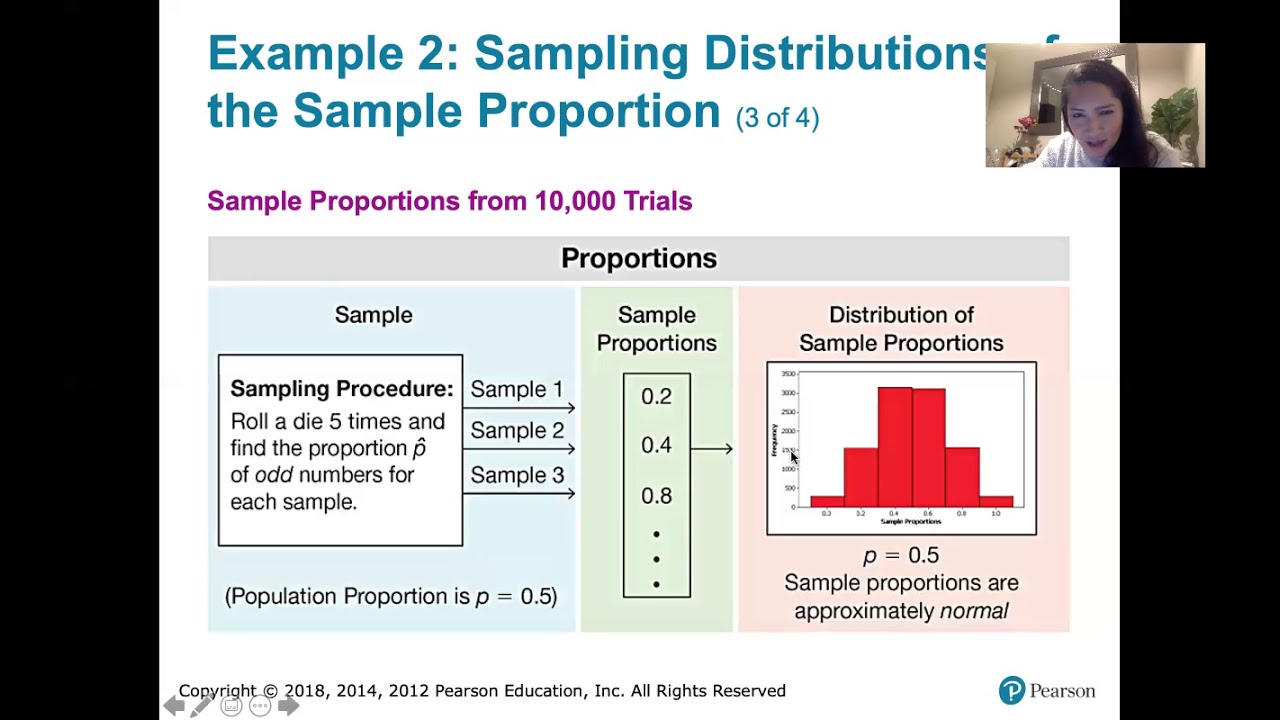
6.3.2 Sampling Distributions and Estimators - Sampling Distribution of Sample Proportions
5.0 / 5 (0 votes)
Thanks for rating: