7.1.0 Estimating a Population Proportion - Lesson Overview, Key Concepts and Learning Outcomes
TLDRThis video script introduces Lesson 7.1 on estimating population proportions, part of the inferential statistics section in 'Essentials of Statistics' by Mario Triola. It contrasts descriptive statistics with inferential statistics, emphasizing the latter's goal of making inferences about larger populations using sample data. The lesson focuses on point estimates and confidence intervals for population proportions, explaining their computation and interpretation. It also addresses determining the sample size needed for a given level of confidence and margin of error, crucial for designing accurate statistical studies.
Takeaways
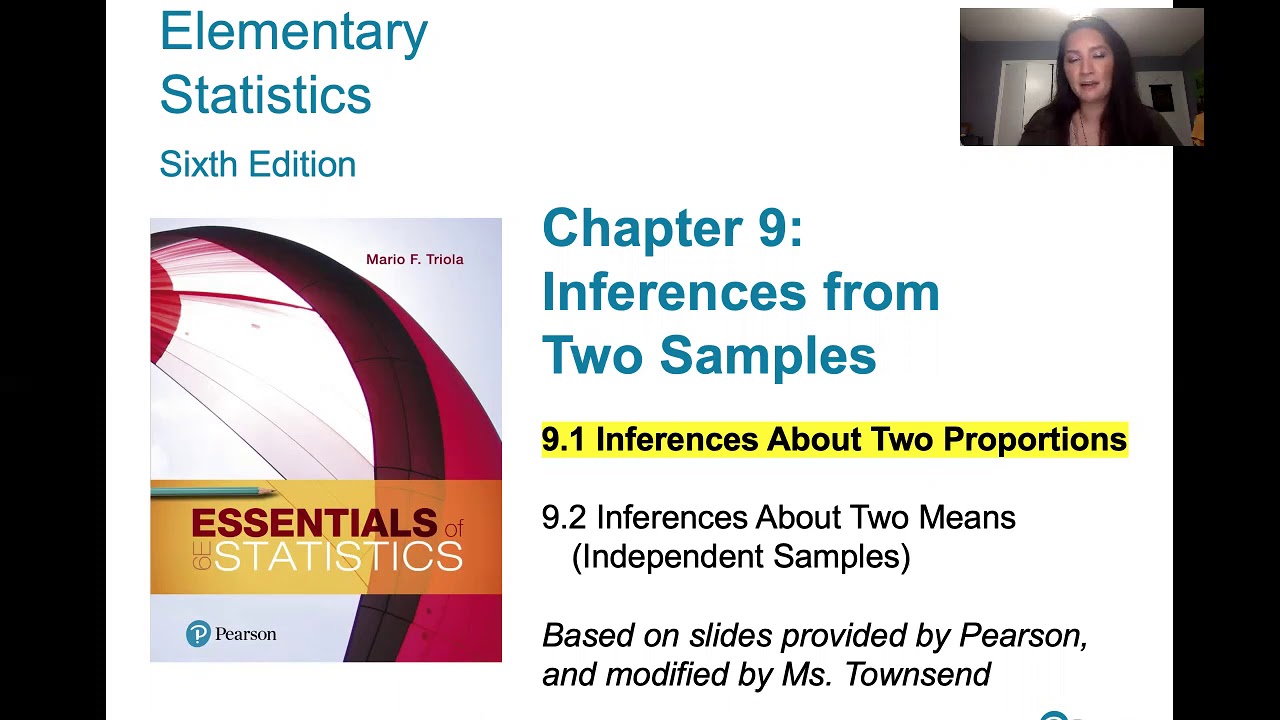
- 📚 The video discusses Lesson 7.1 from the textbook 'Essentials of Statistics' by Mario Triola, focusing on estimating population proportions.
- 🔍 Chapter 7 marks the beginning of inferential statistics, contrasting with descriptive statistics covered in earlier chapters.
- 📈 Descriptive statistics summarize and describe collected data, while inferential statistics use sample data to make inferences about larger populations.
- 🧩 Inferential statistics is divided into two main activities: estimating population parameters and hypothesis testing, with the former being the focus of Chapter 7.
- 📉 The video emphasizes the importance of understanding probability and probability distributions from previous chapters for grasping inferential statistics concepts.
- 🎯 Lesson 7.1 specifically covers estimating the population proportion, starting with a point estimate using the sample proportion (p-hat).
- 📝 The sample proportion (p-hat) is identified as the best point estimate for the population proportion, a concept to be explained in the video.
- 🔑 Confidence intervals are introduced as a method to estimate the true value of the population proportion, indicating the precision of the point estimate.
- 📐 The video will explain how to compute critical values and define the margin of error, both essential for constructing confidence intervals.
- 🔍 Learning outcomes for Lesson 7.1 include finding the point estimate of the population proportion, understanding and interpreting confidence intervals, and calculating the necessary sample size for a desired level of accuracy and confidence.
- ⚖️ The importance of correctly interpreting confidence levels and margins of error is highlighted to avoid common misunderstandings.
Q & A
What is the main focus of Lesson 7.1 in the video?
-Lesson 7.1 focuses on estimating population proportions using sample data.
How does Lesson 7.1 relate to the broader context of the textbook?
-It is the first lesson in a two-lesson section from Chapter 7, which is part of the inferential statistics section of the textbook.
What is the difference between descriptive and inferential statistics?
-Descriptive statistics summarize and describe data, while inferential statistics use sample data to make inferences about a larger population.
Why is understanding probability important for Lesson 7.1?
-Understanding probability is crucial because the concepts covered in Lesson 7.1 are based on the ideas of probability distributions studied in previous chapters.
What are the two major activities of inferential statistics?
-The two major activities are estimating values of population parameters using sample data and using sample data to test claims or hypotheses about population parameters.
What is the best point estimate for the population proportion according to the video?
-The sample proportion, denoted as p-hat, is the best point estimate for the population proportion.
What is a confidence interval and why is it used?
-A confidence interval is an interval estimate that provides a range of values within which the true population parameter is likely to fall, and it is used to assess the precision of the point estimate.
How is the sample size determined for estimating a population proportion with a desired degree of accuracy?
-The sample size can be determined using formulas that take into account the desired margin of error and the desired level of confidence.
What is the central limit theorem and how does it relate to Lesson 7.1?
-The central limit theorem states that the distribution of sample means will be approximately normal for a sufficiently large sample size, regardless of the population distribution. This theorem is relevant to Lesson 7.1 as it helps in understanding the sampling distribution of sample proportions.
What are the learning outcomes for Lesson 7.1 as mentioned in the video?
-The learning outcomes include finding a point estimate of the population proportion, describing and interpreting confidence intervals, understanding critical values and their computation, defining the margin of error, constructing a confidence interval for the population proportion, and finding the necessary sample size for a desired degree of accuracy and confidence level.
Why is it important to correctly interpret confidence intervals and confidence levels?
-Correct interpretation is important to avoid misunderstanding the meaning of these statistical measures, as they are often incorrectly interpreted, leading to misconceptions about the precision and reliability of the estimates.
Outlines
📚 Introduction to Inferential Statistics
This paragraph introduces the transition from descriptive to inferential statistics, emphasizing the shift from summarizing known data to making inferences about larger populations. It outlines the structure of Chapter 7, which focuses on estimating population parameters such as proportions, means, and standard deviations. The importance of understanding probability and probability distributions, as covered in previous chapters, is highlighted as foundational knowledge for grasping the concepts of inferential statistics. The paragraph also distinguishes between the two main activities of inferential statistics: estimation of population parameters and hypothesis testing, setting the stage for the topics covered in subsequent chapters.
🔍 Estimating Population Proportion and Confidence Intervals
The second paragraph delves into the specifics of Lesson 7.1, which is centered on estimating the population proportion. It explains that the sample proportion serves as the best point estimate for the population proportion and discusses the rationale behind this. The paragraph further explores the concept of confidence intervals as a method to quantify the uncertainty of the point estimate. It also addresses how to interpret confidence intervals correctly and the significance of critical values in their computation. The learning outcomes for the lesson are outlined, including finding the point estimate, understanding confidence intervals, computing critical values, defining the margin of error, and determining the necessary sample size to achieve a desired level of accuracy and confidence.
Mindmap
Keywords
💡Estimating Population Proportion
💡Descriptive Statistics
💡Inferential Statistics
💡Population Parameters
💡Sample Data
💡Point Estimate
💡Sample Proportion (p-hat)
💡Confidence Interval
💡Margin of Error
💡Critical Values
💡Sample Size
Highlights
Lesson 7.1 focuses on estimating population proportions.
The lesson is based on slides from Pearson's textbook, modified for the course.
Chapter 7 marks the beginning of inferential statistics, distinct from descriptive statistics covered earlier.
Descriptive statistics summarize and describe collected data, while inferential statistics make inferences about larger populations.
Inferential statistics has two major activities: estimating population parameters and hypothesis testing.
Chapter 7 focuses on estimating population parameters like proportion, mean, standard deviation using sample data.
Understanding probability distributions and the central limit theorem from previous chapters is crucial for this section.
The sample proportion (p-hat) is the best point estimate for the population proportion.
Confidence intervals provide an interval estimate of the population proportion, indicating the precision of the point estimate.
Correct interpretation of confidence intervals and levels is important to avoid common misunderstandings.
Critical values are computed based on the desired confidence level and are key to constructing confidence intervals.
Margin of error is defined and used in constructing confidence intervals to reflect the precision of the estimate.
If the margin of error and desired confidence level are known, the necessary sample size can be calculated for estimating the population proportion.
The lesson aims to teach finding point estimates, describing and interpreting confidence intervals, computing critical values, defining margin of error, and determining sample size.
The video will cover these learning outcomes in subsequent parts.
Transcripts


5.0 / 5 (0 votes)
Thanks for rating: