AP Statistics Chapter 8 In-Depth Review Video
TLDRIn this chapter review for AP Statistics, the focus is on confidence intervals. The lesson covers the basics of confidence intervals, including those for proportions and means, and explains their importance in estimating population parameters from sample data. Key concepts discussed include point estimators, margin of error, and interpreting confidence intervals. The video also delves into the conditions required for constructing confidence intervals and provides detailed examples and calculations to solidify understanding. Finally, it covers how to determine the sample size needed for a specific margin of error.
Takeaways
- 📊 Confidence intervals are used to estimate the population parameter based on a sample statistic, such as the sample mean (x̄) or sample proportion (p̂).
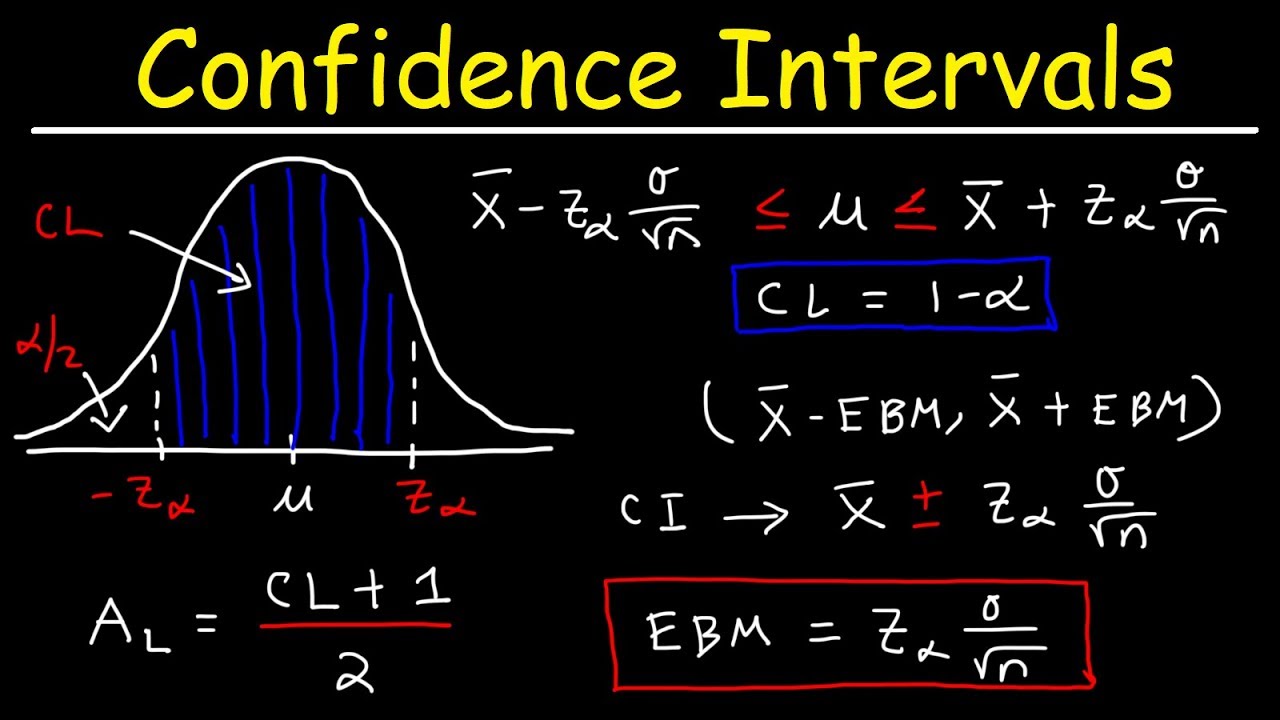
- 🔢 The margin of error (ME) in a confidence interval is calculated as the critical value (CV) multiplied by the standard deviation (SD) of the statistic.
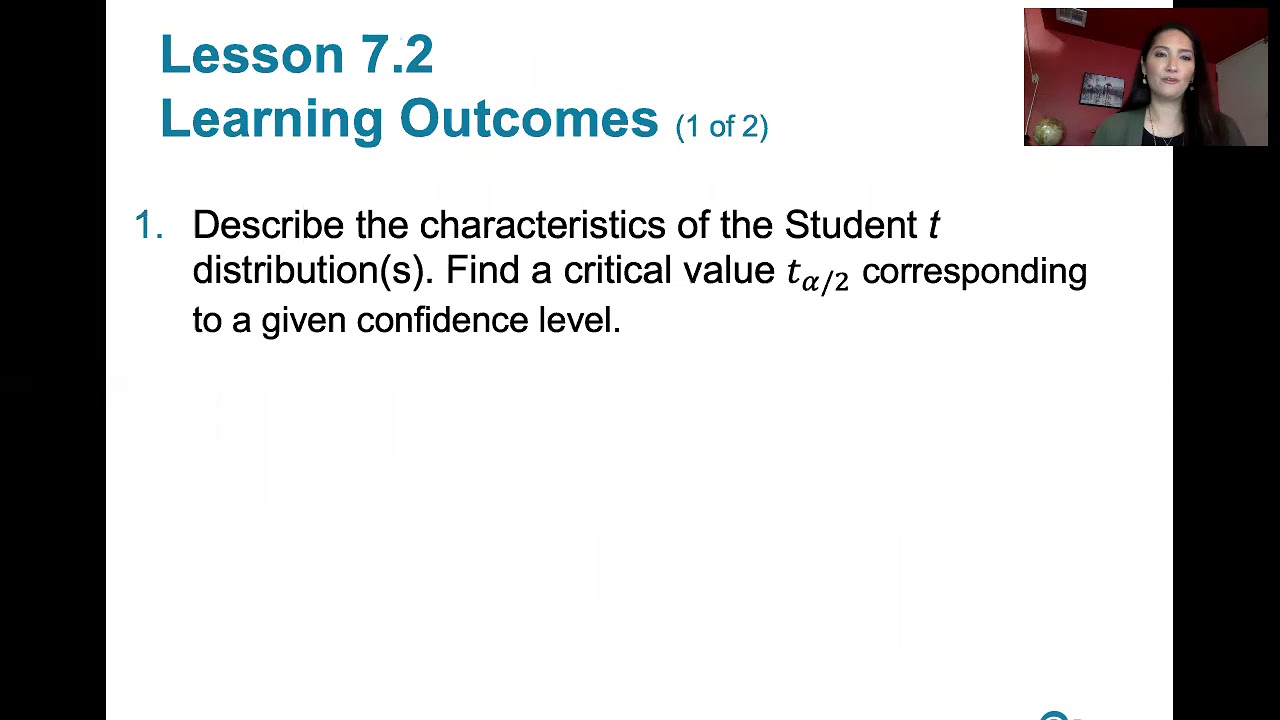
- 🎯 The critical value (Z* or t*) corresponds to the desired confidence level and is used to determine the range within which the population parameter is likely to fall.
- 🧮 For proportions, the standard deviation formula is √[p̂(1 - p̂)/n], and for means, it's SD = σ/√n, where σ is the population standard deviation.
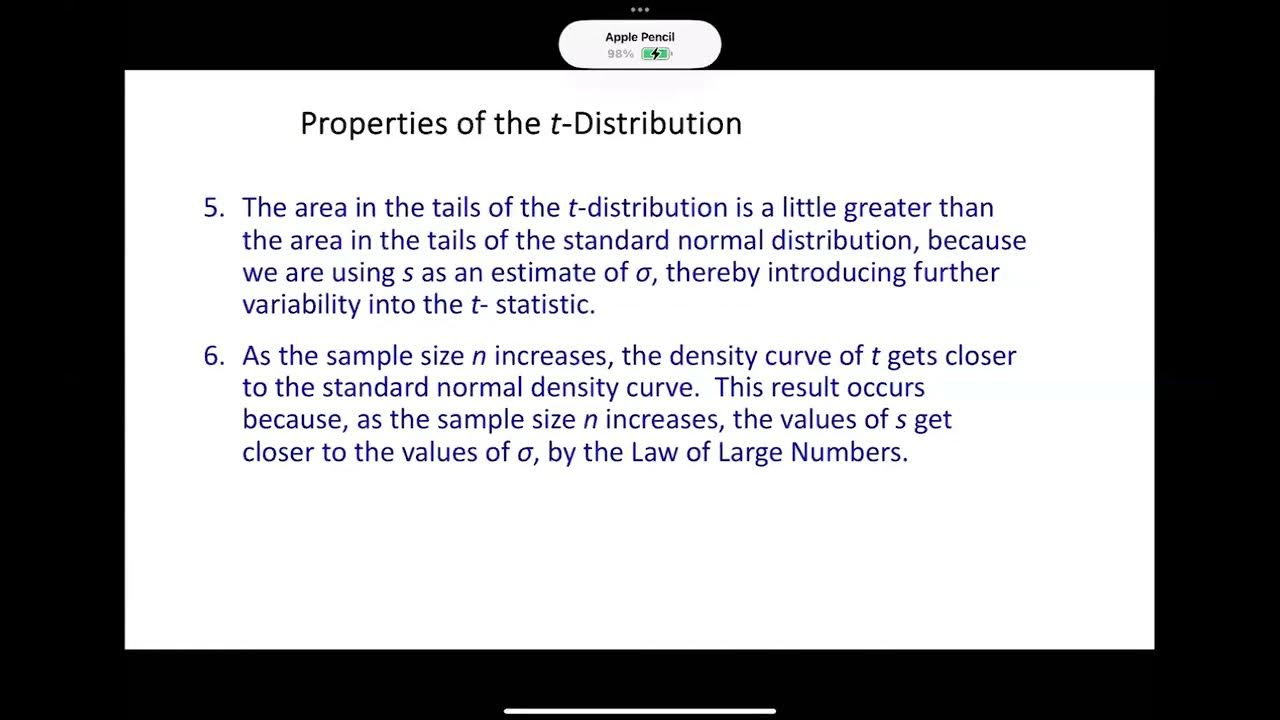
- 📉 When the sample size is small or the population standard deviation is unknown, the t-distribution is used instead of the normal (z) distribution for constructing confidence intervals.
- ✅ To construct a confidence interval, follow the formula: Point Estimate ± (Critical Value × Standard Error).
- 🔍 The confidence level (C%) indicates that, in the long run, about C% of the confidence intervals will contain the true population parameter.
- 📉 The t-distribution is wider than the normal distribution, especially with smaller sample sizes, reflecting greater uncertainty.
- ⚖️ Degrees of freedom (DF) in the context of the t-distribution is one less than the sample size (n - 1) and affects the shape of the t-distribution.
- 🔑 To determine the sample size needed for a given margin of error and confidence level, use the formula that relates the margin of error, critical value, standard deviation, and sample size.
- 🚫 It's important to check the conditions for using confidence intervals, such as random sampling, the 10% condition (sample size is less than 10% of the population), and the large counts condition (both successes and failures are at least 10 for proportions).
Q & A
What is a confidence interval?
-A confidence interval is a range where the point estimate or statistic is at the center, and it provides a margin within which the actual population parameter is expected to fall.
Why do we need confidence intervals in statistics?
-We need confidence intervals because we often only have one sample from a population. Confidence intervals help us estimate where the population parameter is likely to be based on the sample statistic.
What is the difference between confidence intervals for proportions and means?
-The main difference is in their calculations and formulas. Confidence intervals for proportions use the sample proportion (p-hat) and involve binomial distribution concepts, while confidence intervals for means use the sample mean (x-bar) and involve the normal or t-distribution depending on the sample size.
How do you interpret a 95% confidence interval?
-You interpret it by saying, 'We are 95% confident that the interval from [lower bound] to [upper bound] captures the true [parameter being measured, such as mean or proportion] of the population.'
What is the margin of error in a confidence interval?
-The margin of error is the amount added to and subtracted from the point estimate to create the confidence interval. It accounts for the uncertainty inherent in using a sample statistic to estimate a population parameter.
What conditions must be met to construct a valid confidence interval for proportions?
-The conditions are the random condition (simple random sample), the 10% condition (sample size is less than 10% of the population), and the large counts condition (at least 10 successes and 10 failures in the sample).
How do you find the critical value (z*) for a given confidence level?
-You can find the critical value using a z-table, the inverse normal function on a calculator, or by using statistical tables like Table A or Table B that provide critical values for common confidence levels.
What is the standard error in the context of confidence intervals?
-The standard error is an estimate of the standard deviation of the sampling distribution of a statistic. For proportions, it is the square root of (p-hat * (1 - p-hat) / n), and for means, it is the sample standard deviation divided by the square root of the sample size.
What does it mean if a value is not within the confidence interval?
-If a value, such as a hypothesized population parameter, is not within the confidence interval, it suggests that the value is not a plausible estimate of the population parameter given the sample data.
How do you determine the sample size needed to achieve a desired margin of error?
-To determine the sample size, use the formula n = (z* * σ / ME)^2 for means, where σ is the standard deviation and ME is the margin of error. For proportions, use n = (z* / ME)^2 * p-hat * (1 - p-hat), where p-hat is an estimated proportion. If no prior estimate is available, use p-hat = 0.5 for the maximum sample size.
Outlines
📚 Introduction to Confidence Intervals
The video begins with an introduction to confidence intervals, explaining their importance in estimating population parameters when only a sample is available. It discusses the relationship between the mean of the sampling distribution and the population mean, and introduces the concept of a point estimate. The video also covers the basics of how confidence intervals are constructed, including the point estimate, margin of error, and the role of confidence levels in determining the width of the interval.
🔢 Understanding Confidence Levels and Intervals
This paragraph delves into the concept of confidence levels, explaining how lower confidence levels result in narrower intervals, which are more precise but less certain. It emphasizes the balance between confidence and interval size, and how a 95% confidence interval is a common choice due to its balance of accuracy and confidence. The paragraph also clarifies the interpretation of confidence intervals and their use in practice, including the common misconceptions about the probability of capturing the true parameter value.
📉 Visualizing Confidence Intervals
The speaker provides a visual representation of how confidence intervals are derived from multiple samples and how they relate to the population mean. It discusses the formula for a confidence interval in more detail, introducing the critical value and its role in calculating the margin of error. The paragraph also addresses common misunderstandings about the probability of a specific confidence interval capturing the population mean and the importance of considering confidence intervals in the long run.
⚠️ Cautionary Notes on Confidence Intervals
Several cautionary statements are made regarding the use and interpretation of confidence intervals. It is emphasized that the data must come from a simple random sample for the calculations to be valid. The margin of error is also discussed, highlighting that it only accounts for random sampling variation, not biases. The video provides an example problem involving a company and its employees' physical condition, illustrating how to interpret and calculate a confidence interval from given data.
🚶♂️ Example Problem: Employee Steps and Confidence Interval
An example problem is presented where a company provides pedometers to employees to measure daily steps. The statistician reports a 95% confidence interval for the average number of steps. The video demonstrates how to interpret this interval, calculate the point estimate and margin of error, and address a question about whether the employees are meeting a daily step guideline. It also explains how to determine if there is convincing evidence that the employees are not meeting the guideline based on the confidence interval.
🔍 Conditions and Formula for Proportions
The video moves on to discuss confidence intervals for proportions, outlining the three main conditions that must be met: random selection, a sample size that is less than 10% of the population size, and a large counts condition where both the number of successes and failures must be at least 10. The formula for the confidence interval of a proportion is introduced, explaining the use of the sample proportion (p-hat) and the standard error. The concept of the critical value Z-star is also explained in the context of finding confidence intervals for proportions.
🧮 Calculating Z-Score for Proportions
This paragraph explains how to calculate the Z-score (Zar) for proportions using different methods, including table lookup, calculator functions, and understanding the standardized normal curve. The importance of using the correct area for the Z-score calculation is emphasized, and alternative methods are provided for situations where exact values are not available in the table. The video also demonstrates how to use a calculator to find the one-sample Z interval for a population proportion.
📐 Writing Solutions for Confidence Interval Problems
The video outlines a structured approach to solving confidence interval problems, emphasizing the importance of stating the objective, planning the method of calculation, performing the calculations, and interpreting the results. An example involving a flu vaccine shortage is used to illustrate this process, including how to construct a confidence interval for a population proportion and how to address additional questions based on the interval.
🧮 Determining Sample Size for Proportions
The video addresses how to determine the sample size needed for a certain margin of error when estimating a population proportion. It explains the formula for the margin of error and how to rearrange it to solve for the sample size (n). The use of a hypothetical p-hat value of 0.5 is recommended when no prior information is available, and an example calculation is provided to demonstrate the process.
📈 Conditions and Formula for Means
The video introduces the conditions for constructing confidence intervals for means, which are similar to those for proportions but with an additional check for normality. If the sample size is 30 or more, or the data is approximately normally distributed, the conditions are met. The formula for the confidence interval of a mean is presented, involving the sample mean (x-bar), the critical value (t-star), and the standard error. The concept of the t-distribution and degrees of freedom is also explained.
🍪 Example Problem: Oreo Cookie Weight
An example problem involving the weight of Oreo cookies is presented. The video demonstrates how to construct a 95% confidence interval for the mean weight of an Oreo cookie, interpret the interval, and compare it to an advertised serving size. The process of concluding whether the evidence supports the claim that the actual mean weight is less than the advertised weight is shown step by step.
🔢 Determining Sample Size for Means
The video concludes with a discussion on how to determine the sample size needed for a study when estimating a population mean. It explains the use of the margin of error formula and the t-distribution when the population standard deviation is unknown. An example is provided to illustrate the calculation of the minimum sample size required to achieve a specified margin of error with a given confidence level.
👋 Closing Remarks
The video ends with a summary of the key points covered, emphasizing the importance of understanding confidence intervals, the conditions required for their use, and the calculations involved in constructing them for both proportions and means. The presenter expresses hope that the in-depth examples provided will prepare viewers for their tests and concludes the video.
Mindmap
Keywords
💡Confidence Interval
💡Point Estimate
💡Margin of Error
💡Critical Value
💡Population Mean (Mu)
💡Sample Size (n)
💡Standard Deviation
💡Degrees of Freedom (df)
💡T-Distribution
💡Normal Distribution
💡Sampling Distribution
Highlights
Introduction to confidence intervals and their importance in estimating population parameters from sample statistics.
Explanation of why confidence intervals are necessary when dealing with a single sample rather than a sampling distribution.
Differentiating between confidence intervals for proportions and means due to their unique characteristics.
The concept of a point estimator and how it serves as the center of a confidence interval.
The formula for a confidence interval, emphasizing the role of the margin of error and critical value.
Interpreting confidence intervals in the context of capturing the true population mean or proportion.
The impact of confidence level on the width of the confidence interval and the trade-off between confidence and precision.
How to calculate the margin of error using the critical value and the standard deviation.
The use of the central limit theorem to estimate population parameters from sample data.
Conditions that must be met before calculating confidence intervals for both means and proportions.
Detailed steps for constructing a confidence interval for a population proportion, including the use of Z* and the standard error.
The process of determining the sample size needed to achieve a desired margin of error for proportions.
How to use a T-distribution instead of a Z-distribution when the population standard deviation is unknown for means.
The formula for a confidence interval for means and how it differs from that of proportions.
Real-world example of constructing a confidence interval for the mean number of steps taken by employees in a company.
Statistical evidence and how it can be used to support or refute claims about population parameters.
The importance of checking conditions before proceeding with statistical calculations to ensure the validity of results.
Practical application of confidence intervals in public health, such as estimating the proportion of vaccinated individuals in a population.
Transcripts
Browse More Related Video

Math 119 Chap 7 part 1

Elementary Stats Lesson #15
STAT243Z 02/29/24 Zoom Recording

AP Statistics Unit 6 Summary Review Inference For Proportions Part 1 Confidence Intervals
How To Find The Z Score, Confidence Interval, and Margin of Error for a Population Mean
7.2.0 Estimating a Population Mean - Lesson Overview, Key Concepts, Learning Outcomes
5.0 / 5 (0 votes)
Thanks for rating: